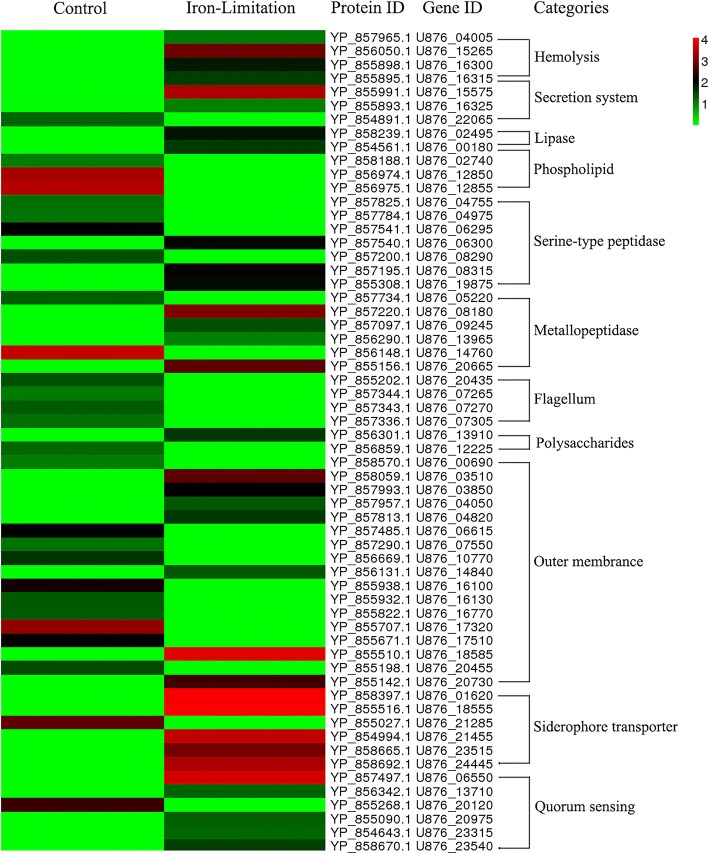
Fig. 5.
Clustering of 60 mainly related virulence genes and proteins. Numbers are listed as the log2 value of difference multiples. Expression differences are shown in different colors; red indicates up-regulation, while green indicates down-regulation. A heatmap was used to visualize the genes and proteins that were related to virulence factor (hemolysis, secretion system, lipase, phospholipid, serine-type peptidase, metallopeptidase, flagellum, polysaccharides, siderophore transporter, quorum sensing, and outer membrane)

