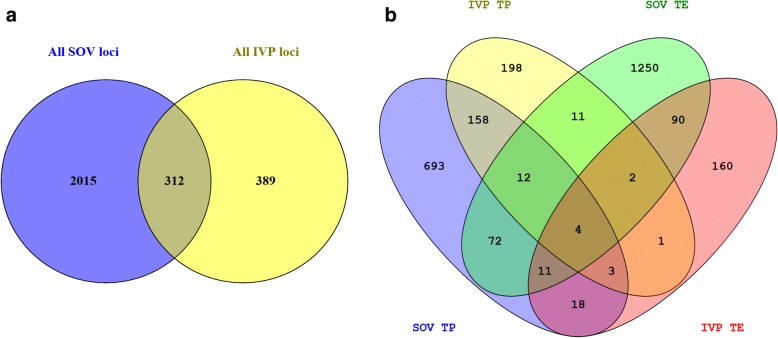
Fig. 2.
a 2-way venn diagram representing overlap of differentially methylated loci between SOV and IVP conceptuses. Duplicate probes that were identified in multiple groups were removed, therefore the total number of loci for SOV and IVP is less than detailed in Table 1, b 4-way venn diagram showing overlap of significant probes for the TE and TP tissues. Images generated using Venny http://bioinfogp.cnb.csic.es/tools/venny/index.html)

