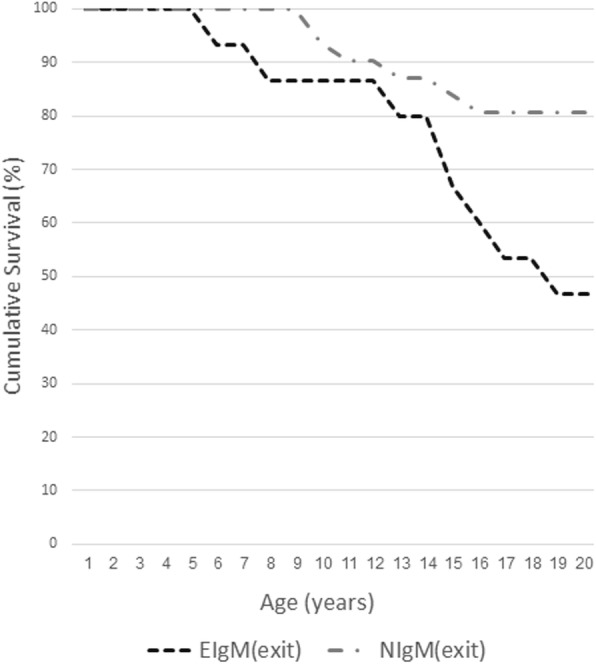
Fig. 1.

Kaplan-Meier curves for mortality in patients with NIgM levels and patients with EIgM. EIgM was associated with significantly increased mortality risk when using Log-Rank test to compare the 2 groups (z = 2.31, p = 0.05). The data is presented as the percent of patients alive at each age. The survival data is presented only for the first 20 years of life since only 7 patients from NIgM group and none of the EIgM group over 20 years of age were included in the study
