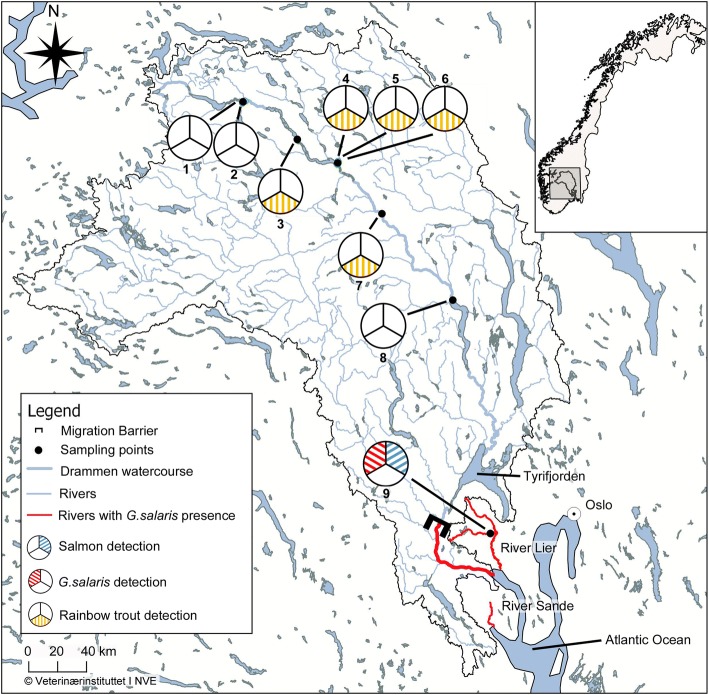
Fig. 1.
Map of the Drammen watercourse region with all sampling locations and its location within Norway. Green points represent localities sampled. The thick blue line represents the Drammen watersystem, the thin blue lines represent the main rivers, the red lines indicate rivers where G. salaris is present and the black lines outline the Drammenselva drainage basin. The numbers refer to the sampling sites in Table 1. Pie charts: blue colour indicates detection of Atlantic salmon, red indicates detection of Gyrodactylus salaris and yellow indicates detection of rainbow trout. Rivers flow north to south

