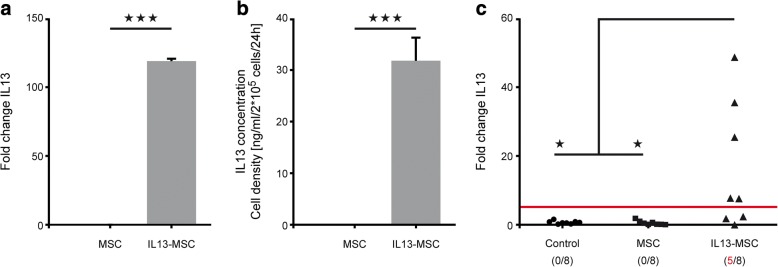
Fig. 2.
In vitro and in vivo expression of transgenic IL13 mRNA by IL13-MSCs. a Graph showing the analysis of transgenic IL13 mRNA expression by cultured MSCs and IL13-MSCs in vitro. b Graph showing the analysis of IL13 protein expression by cultured MSCs and IL13-MSCs after 24 h in vitro. c Graph showing the analysis of transgenic IL13 mRNA expression in the non-injected control group, the MSC-injected group, and the IL13-MSC-injected group at 1 week post-injection. Statistical significances are indicated by *** for p ≤ 0.001 and * for p ≤ 0.05

