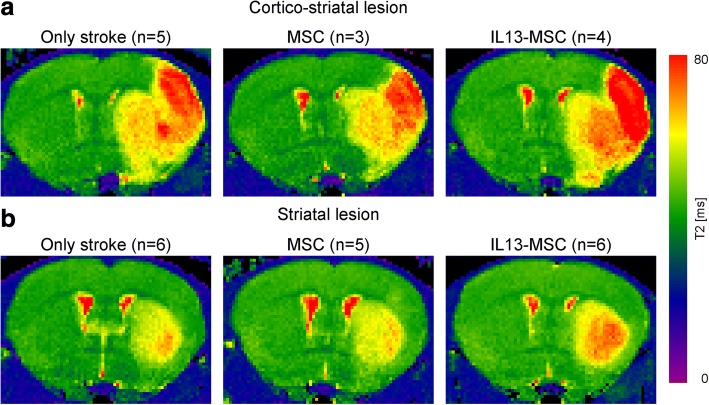
Fig. 3.
Representative T2 maps for lesion location and size of two representative animals from each experimental group 2 days after ischemic stroke. T2 maps are displayed as coronal brain section. Lesions show up as areas of elevated T2 values on T2 maps, representing the area with increased tissue water content following stroke induction. Two characteristic lesion types are visible in the right hemisphere 48 h after MCAO: a lesions involving both striatum and cortex (n = 12) and b lesions restricted to the striatum (n = 5)

