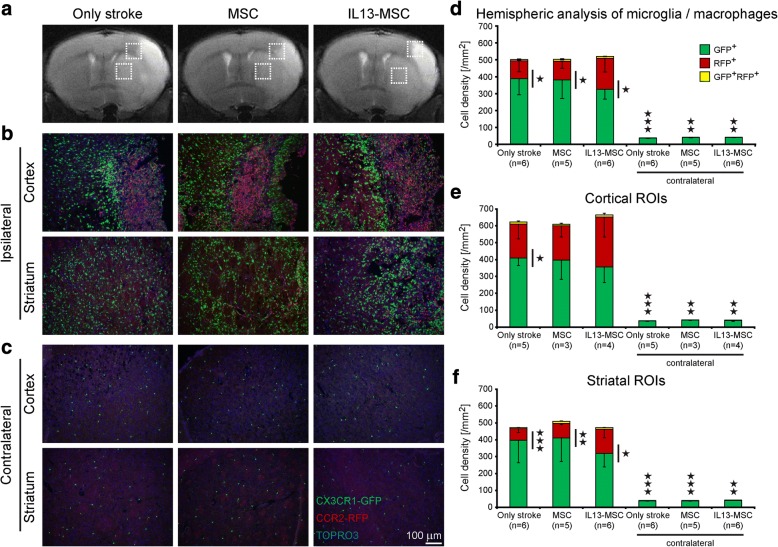
Fig. 4.
Localization and cell density of microglia and macrophages 2 weeks after ischemic stroke. a Representative coronal T2-weighted MR images are displayed above the corresponding immunohistochemistry images of all experimental groups. The hyperintense regions in the coronal MR images show the ischemic lesion 2 days post stroke. b–c Fluorescent microscopic images of brain coronal sections of all experimental groups represent the distribution of CX3CR1eGFP microglia and CCR2RFP macrophages at day 14 after stroke; b localization of eGFP+ microglia and RFP+ macrophages in ipsilateral cortical and striatal ischemic lesions, and c in contralateral cortical and striatal intact regions. Immunofluorescence colors: blue, TOPRO; green, microglia; red, macrophages. d–f Representative stacked column graphs show the cell density quantification of all experimental groups at day 14 after stroke. d Evaluation of microglia/macrophage cell density in the whole hemisphere. No significant difference was observed in the total number of eGFP+ microglia and RFP+ macrophages between the three experimental groups. CX3CR1eGFP/+ cell density is significantly higher than CCR2RFP/+ cell density in all three experimental groups at day 14 after stroke. In intact contralateral hemisphere, eGFP+ microglia was the main population. e Further evaluation of microglia and macrophage cell density in cortical lesion areas, and f in striatal lesion areas. The cell density of recruited microglia and macrophages was higher in large cortical lesion areas compared to striatal lesion areas. Data represent mean ± SD. The data were compared between the three experimental groups using a parametric one-way ANOVA test with Bonferroni’s post hoc test. To compare the CX3CR1eGFP/+ cell density to CCR2RFP/+ cell density in each group, an independent one-tailed Student’s t test was used

