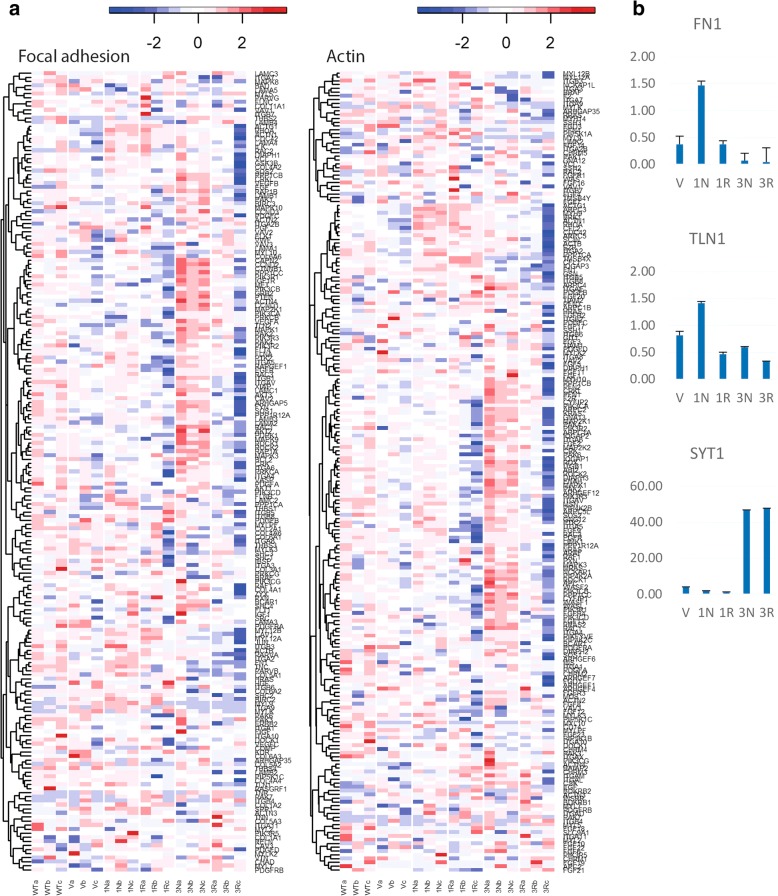
Fig. 2.
Expression profiling of the CCHCR1-HEK293 cell lines highlighted cell adhesion and actin cytoskeleton. a Heatmaps showing gene expression of focal adhesion and regulation of actin cytoskeleton in the CCHCR1 Iso1Non-risk (1 N), Iso1Risk (1R), Iso3Non-risk (3 N), and Iso3Risk (3R) cell lines, and in the vector transfected cells (V), and wild type HEK293 (WT). Color key: red represents upregulated and blue downregulated expression (row Z-score). b The expression of FN1, TLN1, and SYT1 in the CCHCR1-HEK293 cell lines was validated with qPCR, and compared with the gene expression in the wild type cells. Error bars: standard deviation. Here shown normalization with HPRT1

