Fig. 5.
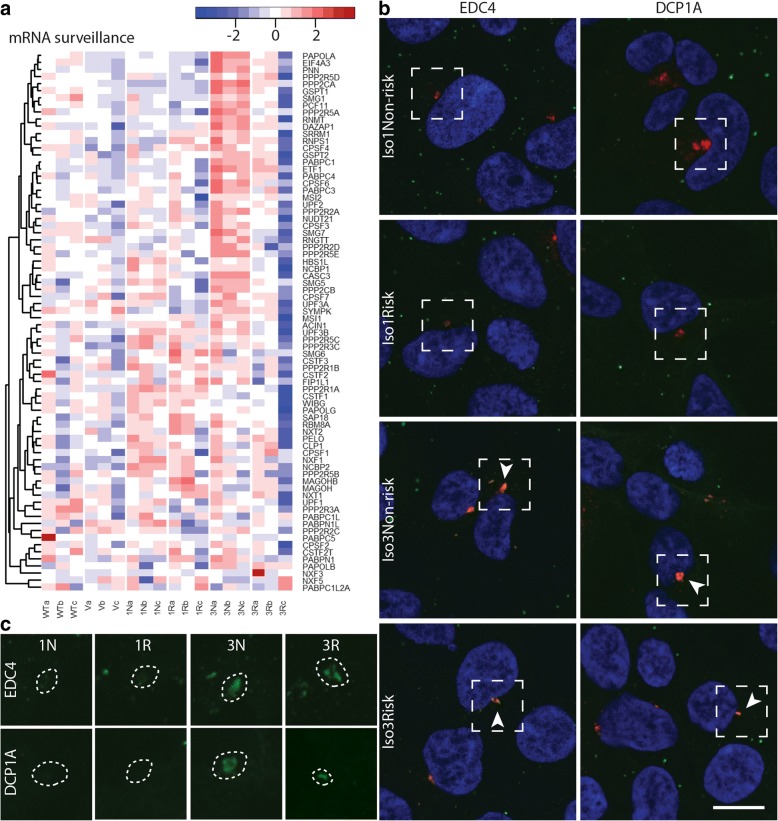
CCHCR1 shows isoform-specific localization with centrosomal P-bodies and affects mRNA surveillance pathway. a Heatmap showing gene expression profiles of mRNA surveillance pathway in Iso1Non-risk (1 N), Iso1Risk (1R), Iso3Non-risk (3 N), and Iso3Risk (3R) CCHCR1-HEK293 cell lines, and in control cells; vector (V) and wildtype (WT). Color key: red represents upregulated and blue downregulated expression (row Z-score). b Immunofluorescent staining of the CCHCR1 (red) cell lines: Iso1Non-risk, Iso1Risk, Iso3Non-risk, and Iso3Risk, with the P-body markers (green) EDC4 and DCP1A. Panel b shows the overlap of red and green, and panel c shows the green channel images of the corresponding sites. The colocalization (orange) of CCHCR1 and P-body markers is absent in the Iso1Non-risk and Iso1Risk cells: only the CCHCR1 expression (red) is observable at the centrosomes and cytoplasm (b), whereas the antibodies against EDC4 and DCP1A fail to recognize these structures (c). In Iso3Non-risk and Iso3Risk, the colocalization (orange, marked with arrow heads in panel b) is observable with antibodies against the EDC4 and DCP1A (green in panel c). Nuclei are stained with DAPI (blue). Scale bar: 10 μm

