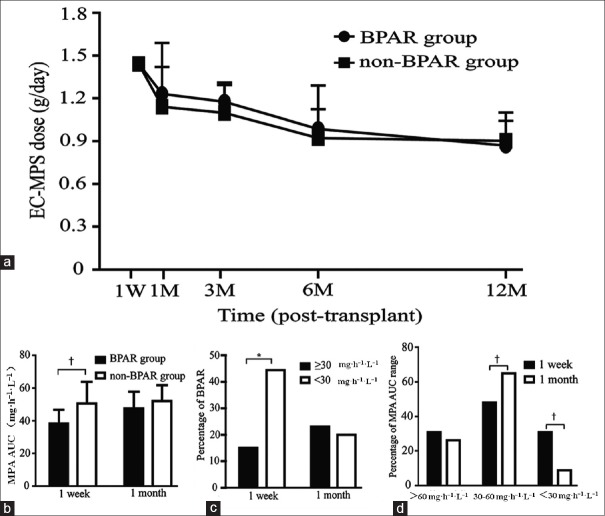
Figure 1.
MPA exposure and the risk of BPAR. (a) EC-MPS dose in BPAR (n=14) and non-BPAR (n=44) groups during the first 12 months. (b) MPA-AUC0-12h in BPAR and non-BPAR groups at the 1st week and 1st month posttransplantation. (c) The percentage of BPAR when MPA-AUC0-12h <30 mg·h-1·L-1 and at ≥30 mg·h-1· L-1 at the 1st week and 1st month posttransplantation. (d) The percentage of MPA-AUC0-12h range at the 1st week and 1st month posttransplantation. *P < 0.05, †P < 0.01. Produced by GraphPad Prism version 6.02 (GraphPad Software Inc., La Jolla, CA, USA). BPAR: Biopsy-proven acute rejection; EC-MPS: Enteric-coated-mycophenolate sodium; MAP: Mycophenolic acid; AUC: Area under the curve.

