Figure 2.

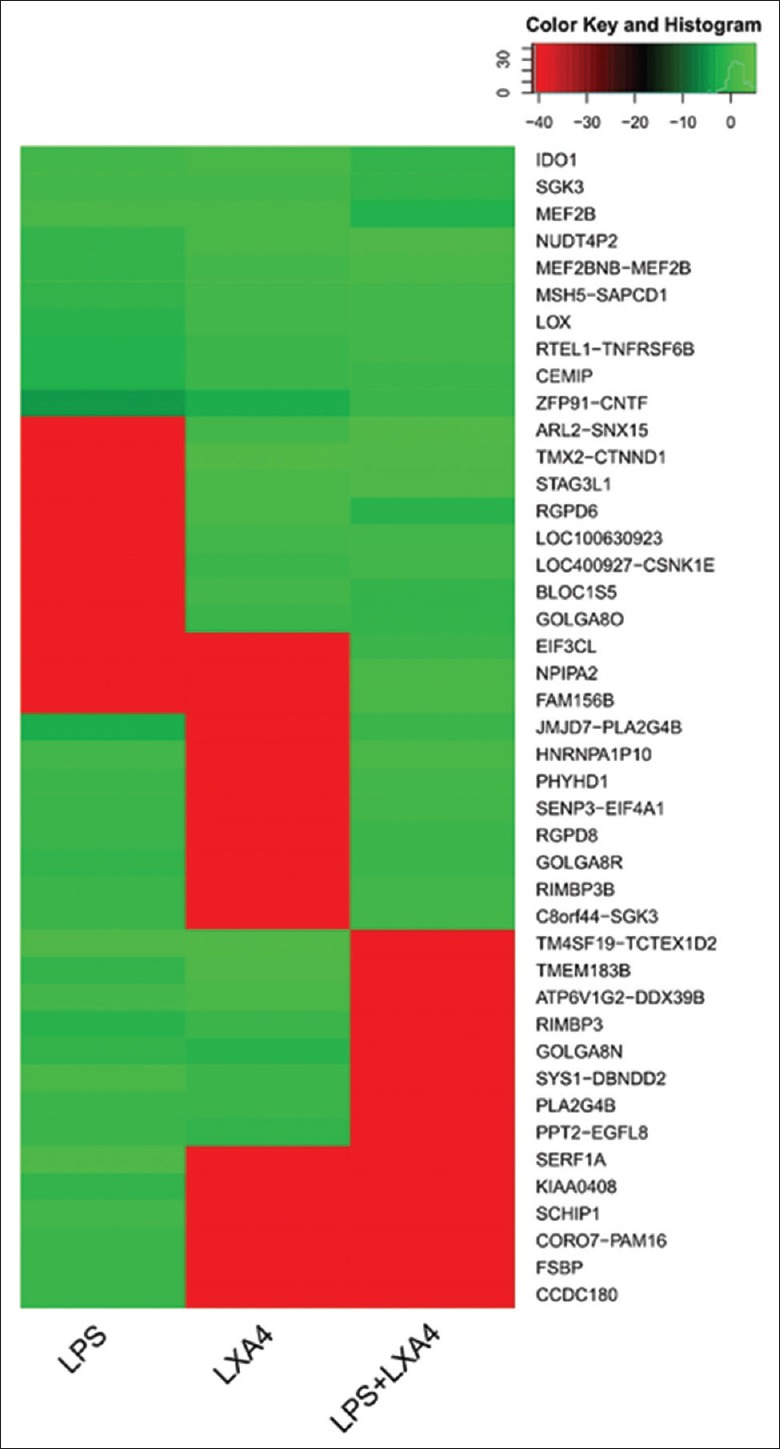
Transcriptome sequencing and comparison of the treated A549 cells. Transcriptome array analysis of A549 cells treated with LPS (1 μg/ml), LXA4 (100 nmol/L), and in combination, respectively. LXA4: Lipoxin A4; LPS: Lipopolysaccharide.

Transcriptome sequencing and comparison of the treated A549 cells. Transcriptome array analysis of A549 cells treated with LPS (1 μg/ml), LXA4 (100 nmol/L), and in combination, respectively. LXA4: Lipoxin A4; LPS: Lipopolysaccharide.