
Figure 2.
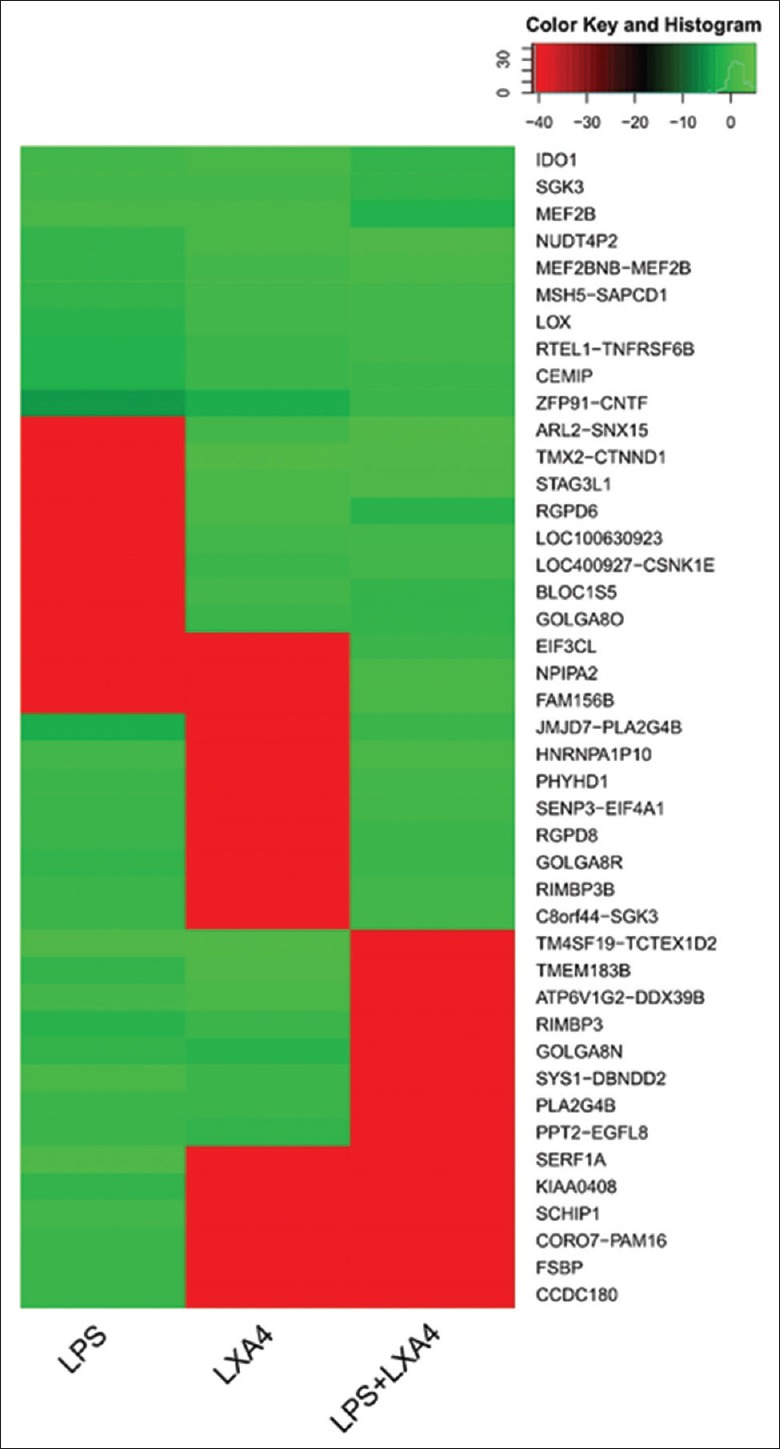
Transcriptome sequencing and comparison of the treated A549 cells. Transcriptome array analysis of A549 cells treated with LPS (1 μg/ml), LXA4 (100 nmol/L), and in combination, respectively. LXA4: Lipoxin A4; LPS: Lipopolysaccharide.
Official websites use .gov
A
.gov website belongs to an official
government organization in the United States.
Secure .gov websites use HTTPS
A lock (
) or https:// means you've safely
connected to the .gov website. Share sensitive
information only on official, secure websites.
Transcriptome sequencing and comparison of the treated A549 cells. Transcriptome array analysis of A549 cells treated with LPS (1 μg/ml), LXA4 (100 nmol/L), and in combination, respectively. LXA4: Lipoxin A4; LPS: Lipopolysaccharide.