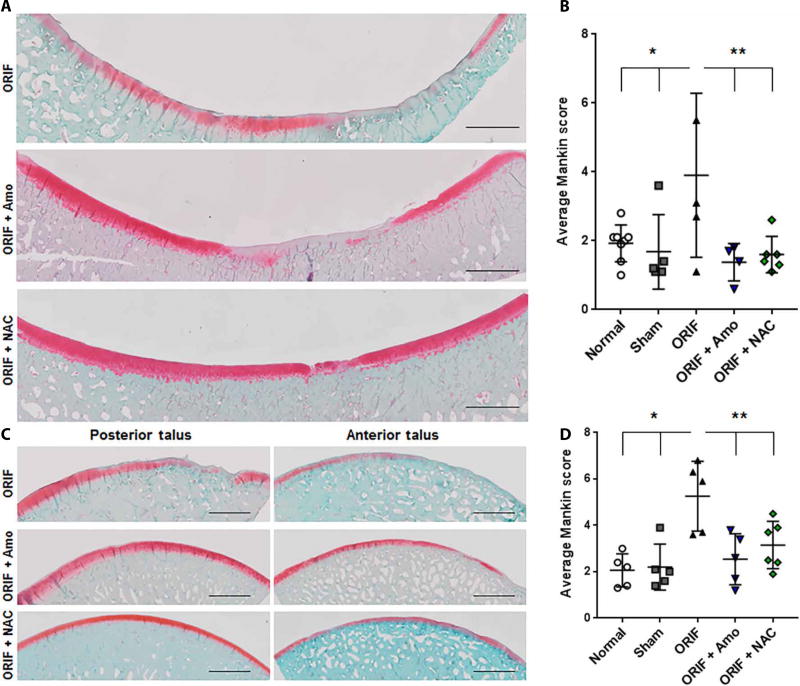
Fig. 2. Acute administration of amobarbital or NAC after IAF prevents PTOA development 6 months after IAF.
(A) Representative images of the loaded portion of the porcine medial tibia stained for proteoglycan content via safranin O 6 months after fracture [n = 8 for normal, n = 5 for sham, n = 5 for open reduction and internal fixation (ORIF), n = 4 for ORIF + amobarbital (Amo), n = 6 for ORIF + N-acetylcysteine (NAC)]. Images are a composite of 20X scans across the entire anterior-posterior length of the surface. Scale bars, 2 mm. (B) Semi-automated Mankin scoring of the loaded areas of the medial tibia spanning both the anterior and posterior segments [n same as in (A); * P < 0.05 versus normal and sham; ** P < 0.05 versus ORIF; all via two way ANOVA with Dunnett’s posttest). (C) Representative images of the loaded portions of the porcine medial talus stained for proteoglycan content via safranin O 6 months after fracture (n = 8 for normal, n = 5 for sham, n = 5 for ORIF, n = 5 for ORIF + amobarbital, and n = 6 for ORIF + NAC). Images are a composite of 20X scans across either the anterior or posterior (samples cut in half for staining) length of the talus. Scale bars, 2 mm. (D) Semi-automated Mankin scoring of the loaded areas of the medial talus spanning both the anterior and posterior segments (n same as (C), * P < 0.05 versus normal and sham, ** P < 0.05 versus ORIF, all via two way ANOVA with Dunnett’s post-test). Data represent the mean with SD shown.

