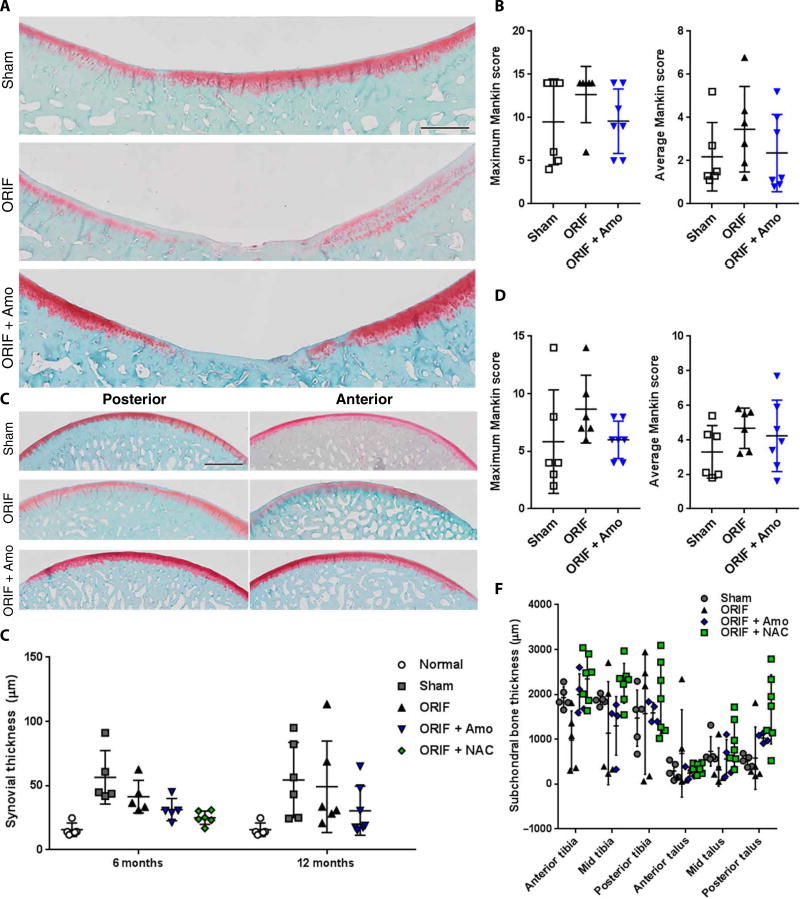
Fig. 3. Sham surgical procedures used for IAF modeling cause indications of PTOA by 12 months after ORIF.
(A) Representative images of the loaded portion of the porcine medial tibia stained for proteoglycan content via safranin O 12 months after fracture (n = 6 for sham, n = 6 for ORIF, n = 7 for ORIF + amobarbital). Images are a composite of 20X scans across the entire anterior-posterior length of the surface. Scale bar, 2 mm. (B) Semiautomated Mankin scoring of the loaded areas of the porcine medial tibia spanning both the anterior and posterior segments, with maximum and average values given [n same as in (A); all P > 0.05 versus sham as indicated by two-way ANOVA with Dunnett’s posttest]. (C) Representative images of the loaded portions of the porcine medial talus stained for proteoglycan content via safranin O 12 months after fracture [n same as in (A)]. Images are a composite of 20X scans across either the anterior or posterior (samples cut in half for staining) length of the talus. Scale bar, 2 mm. (D) Semiautomated Mankin scoring of the loaded areas of the porcine medial talus spanning both the anterior and posterior segments, with maximum and average values given [n same as in (A)]. (E) Synovial thickness measured from the posterior portion of the capsule at 6 and 12 months [n as indicated in Fig. 2 or in (A) for 6 and 12 months, respectively; * P < 0.05 versus normal via two way ANOVA with Dunnett’s posttest]. (F) Subchondral bone thickness at 6 months from micrographs used for Fig. 2 (n as indicated in Fig. 2, no significant difference found via two way ANOVA with Dunnett’s posttest). Data represent the mean with SD shown.

