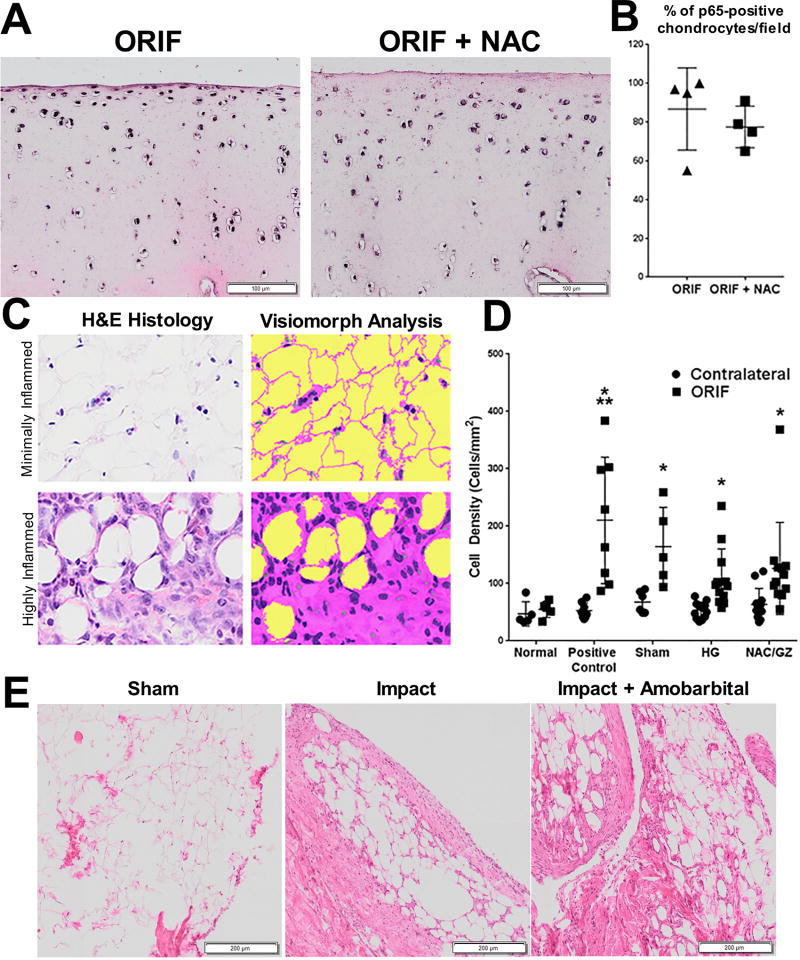
Fig. 6. Increases in joint inflammation 1 week after IAF were not prevented by NAC or amobarbital.
(A) Representative micrographs from porcine anterior talar specimens 1 week after IAF with and without NAC (and glycyrrhizin, an agent intended to decrease inflammation that had a minimal, if any, effect and was added in this treatment group only) that have been formalin fixed and immunohistochemically stained for p65. (B) Quantitation of percent p65 positive-staining cells per 20X field from (A) (n = 4 for all groups; no significant differences noted via Student’s t-test). (C) Illustration of the tissue and cell identification routine developed in Visiomorph software shown under minimally (top) and highly (bottom) inflamed conditions. In the analysis of hematoxylin and eosin (H&E) images, tissue is classified as pink, cell nuclei as purple, and empty space as yellow. Cell counts and tissue areas are calculated from these color-coded images. (D) Average monocyte infiltration quantified from porcine infrapatellar fat pads 1 week after ORIF and a single treatment injection of either hydrogel only (HG) or NAC and glycyrrhizin (NAC/GZ) (n = 5 for normal, n = 8 for positive control, n = 6 for sham, n = 12 for HG and n = 12 for NAC/GZ; * P < 0.01 ORIF versus contralateral for each group except normal via two way ANOVA; ** P < 0.01 for positive control ORIF versus sham ORIF only). Data represent the mean with SD shown. (E) Representative micrographs of rabbit stifle (knee) synovia 1 week after severe impact stained with H&E (n = 3). Scale bar, 250 mm.

