Fig. 3.

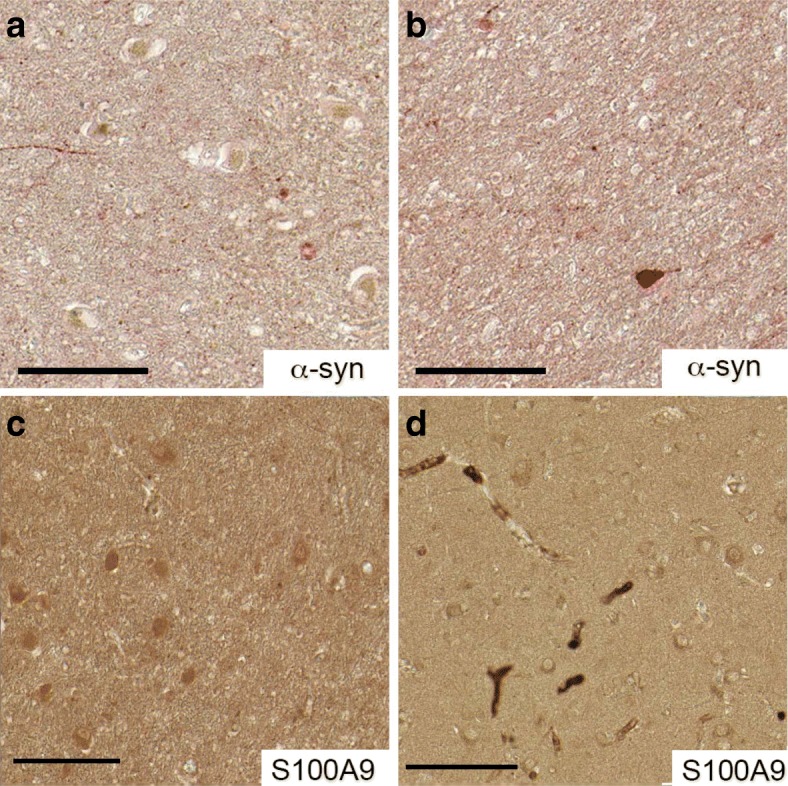
Immunohistochemical analysis of the brain tissues of four control cases. Representative immunostaining with α-syn (a, b) and S100A9 (c, d) antibodies of the substantia nigra (a, c) and frontal lobe (b, d) tissues, respectively. Neuromelanin is shown in brown color and immunostaining with corresponding antibody in reddish color. Scale bars are 100 μm
