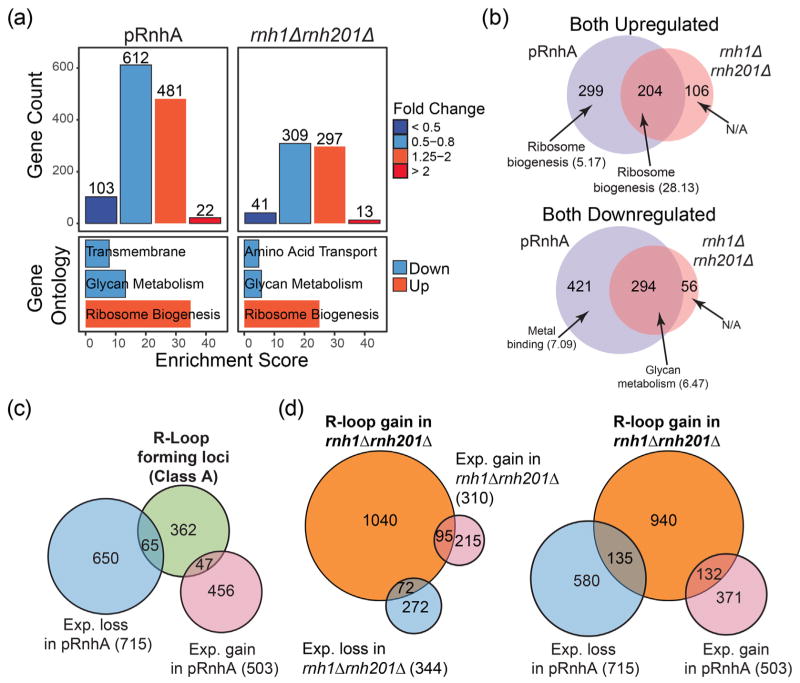
Fig. 4.
Manipulations of R-loop levels impact transcription mostly at genes that do not form detectable R-loops. (a) Top: Histogram showing the number of transcripts that were down-regulated and up-regulated after expression of RnhA (pRnhA) or deletion of both endogenous RNase H enzymes (rnh1Δrnh201Δ). Bottom: GO analysis of up- and down-regulated transcripts. (b) Venn diagram showing the overlap between the transcripts that are up- (top) and down-regulated (bottom) in pRnhA and rnh1Δrnh201Δ. GO term enrichment is indicated. (c) Venn diagram showing the overlap between the transcripts forming class A R-loops and the transcripts whose levels are affected upon RnhA expression. (d) Venn diagram showing the overlap between the transcripts forming R-loops in rnh1Δrnh201Δ and the transcripts whose levels are affected in rnh1Δrnh201Δ (left) or upon RnhA expression (right).

