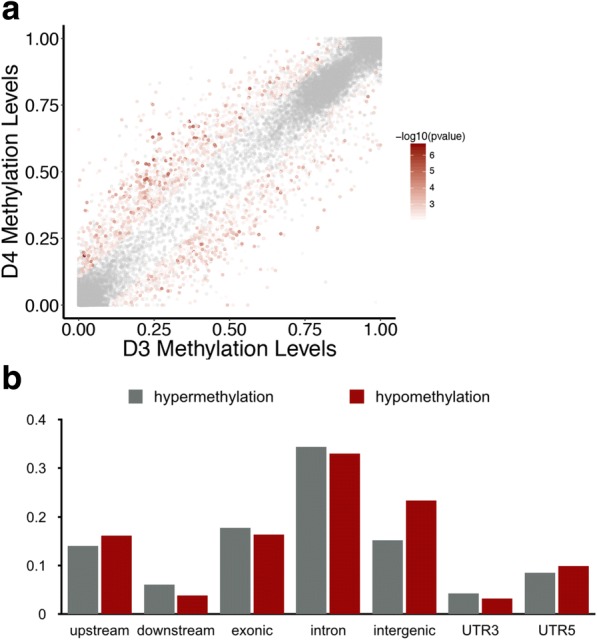
Fig. 3.

Distribution of D3 specific DMRs. a The scatter plot shows the found DMRs, the red color indicates the p-value, and non-significant regions are showed in gray. b The distribution of significantly DMRs. All DMRs are classified into 2 main categories (hypermethylation and hypomehtylation), and each category is further classified into 7 classes (upstream, downstream, intergenic, exonic, intronic, UTR5, UTR3) according to the relative position of nearby genes. The bar plot shows the proportion of each class. There are 294 genes that have a differentially methylated region in upstream (2 kb) of transcription start site
