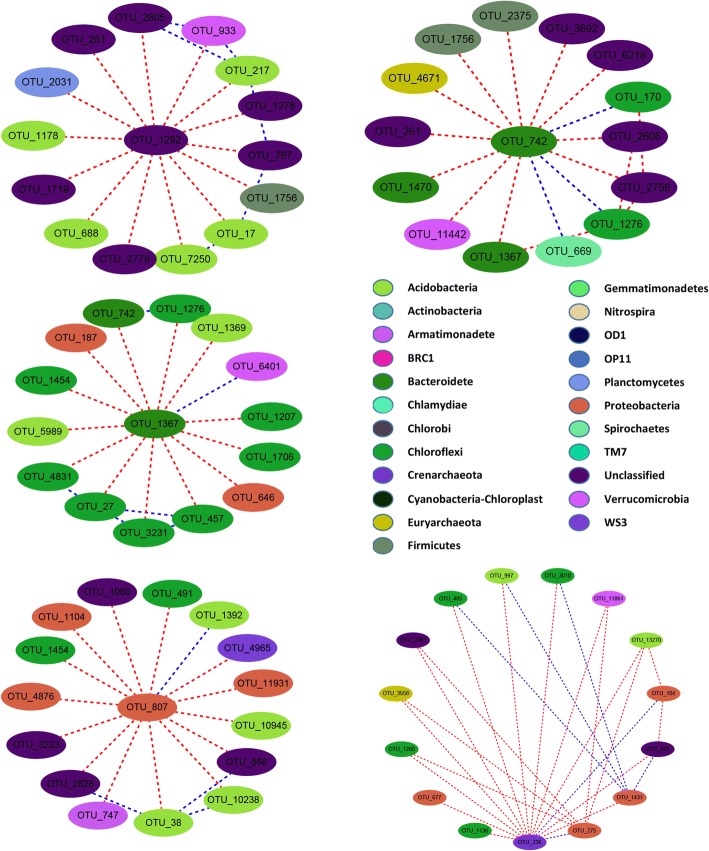
Fig. 4.
Network constructed by thethe highest level (highly degree) of bacterial communities in site Ly. Each node signifies an OTU that corresponds to a microbial population. Colours of the nodes indicate different major phyla. Blue and red lines represent positive and negative path coefficients, repectively

