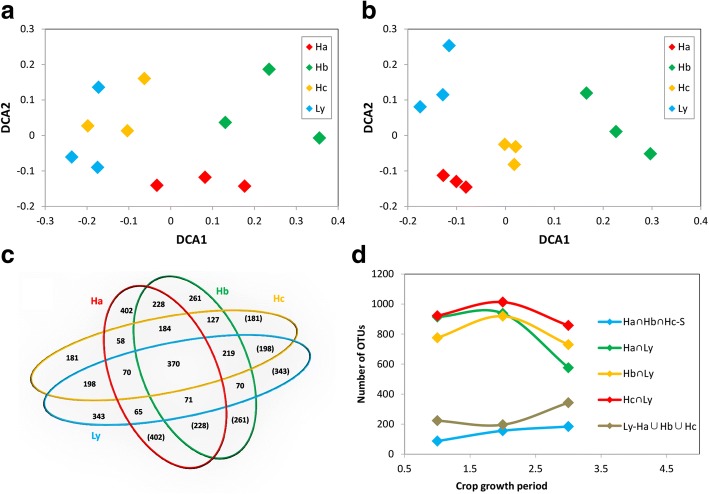
Fig. 5.
Analsis of compositions and structures of bacterial communities from four groups. (a) Detrended correspondence analysis (DCA) of 16S rRNA gene sequencing data at the genus level during the tillering stage; (b) Detrended correspondence analysis (DCA) of 16S rRNA gene sequencing data at the genus level during the heading stage; (c) Venn diagrams were calculated by R with the package gplots and based on OTU level during the heading stage. Figures in pictures represent the taxa number of OTUs with common ownership at different sites; (d) Variation trends in OTUs under different classifications from pre-transplanting to heading stages. ∩: Intersection of mathematical symbol; ∪:Union mathematical symbol; and S: Ha∩Hb∩Hc∩Ly (intersection of four sites)

