
Fig. 6.
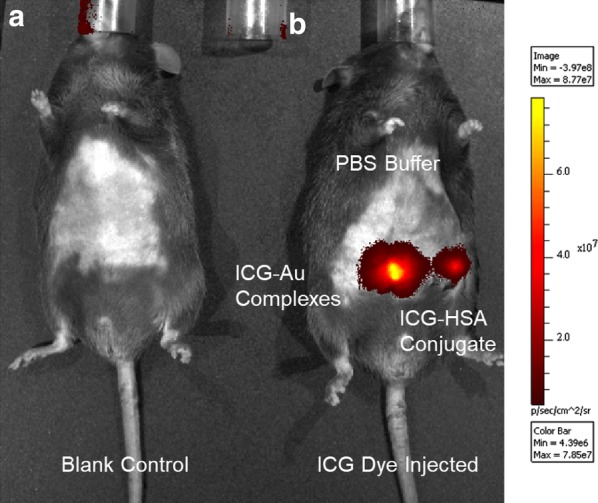
In-vivo fluorescence tomography images of mice using the ICG-Au complexes as contrast agent injected below the skin of mice. The images were collected on a Xenogen IVIS-200 small animal tomography system with a bandpass filter from 665 to 695 nm for the background, a filter from 710 to 760 on the excitation side, and a filter from 810 to 875 nm on the emission side. A 750 nm laser was used as the excitation source. Total photon flux (photons/s) was calculated and corrected for tissue depth by spectral imaging using Living Image 3.0 software (Xenogen). The left image (a) was collected on a control mice and the right image (b) was collected by injection with the ICG-Au complex, ICG–HSA conjugate, or a blank PBS buffer solution with the same volume on the same mice