Fig. 7.
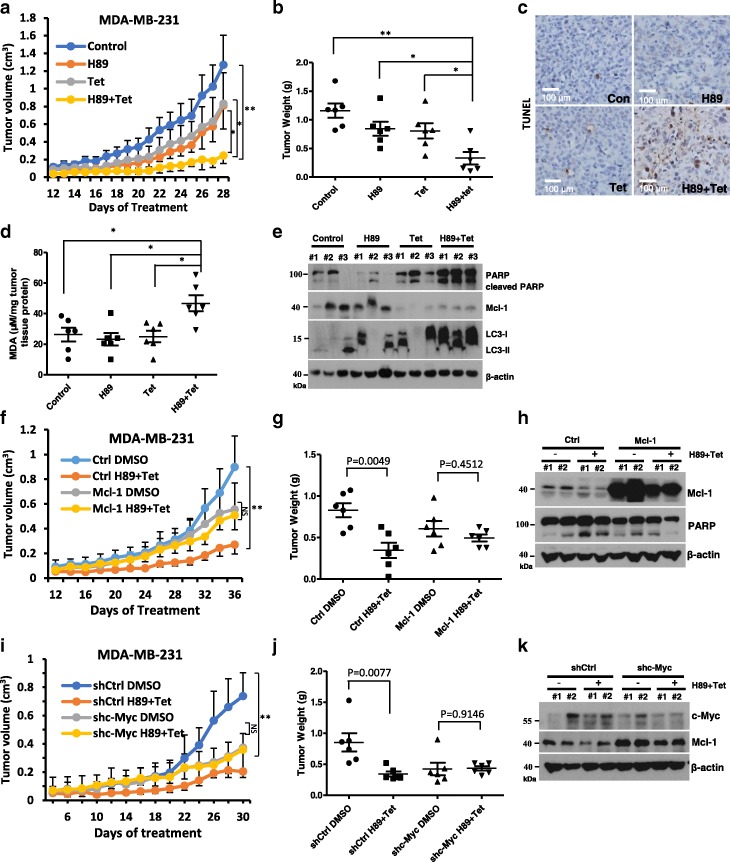
Combination treatment with H89 and tetrandrine leads to a regression of xenograft tumors. a MDA-MB-231 cells were inoculated into BALB/c mice (via s.c. injection) to establish a tumor model as indicated in the Materials and Methods section. Mice bearing tumors were randomly assigned to groups (six mice per group) and treated with vehicle, H89 (10 mg/kg), tetrandrine (25 mg/kg) alone or a combination of H89 and tetrandrine (H89 10 mg/kg and tetrandrine 25 mg/kg) every other day. The tumor volume was measured (the bars represent the means ± SD). b Scatter plots display the quantitative tumor weights at the end of the experiment. c MDA-MB-231 transplanted tumors were dissected and subjected to a TUNEL assay. Scale bars, 100 μm. d The level of the oxidative stress marker MDA was measured in the tumor tissues. e Cleaved-PARP, Mcl-1 and LC3 were analyzed by Western blot from tumor tissue lysates. f BALB/c mice (n = 6) were transplanted with MDA-MB-231 Ctrl or Mcl-1 overexpressing cells and treated with DMSO or H89/tetrandrine (H89 10 mg/kg and tetrandrine 25 mg/kg) every other day; tumor volumes were measured during the study. g Scatter plots display the quantitative tumor weights. h Western blot of tumor lysates from MDA-MB-231 Ctrl or Mcl-1-bearing mice with the indicated treatments. i BALB/c mice (n = 6) were transplanted with MDA-MB-231 shCtrl or shc-Myc cells and treated as previously described, and the tumor volume and j tumor weight are shown. k Western blot of tumor lysates from MDA-MB-231 shCtrl or shc-Myc-bearing mice with the indicated treatments. Data are reported as the mean ± SD and were analyzed by Student’s t-test; n = 6 mice per group; *P < 0.05, **P < 0.01 and NS = not significant. All images are representative of six mice per group

