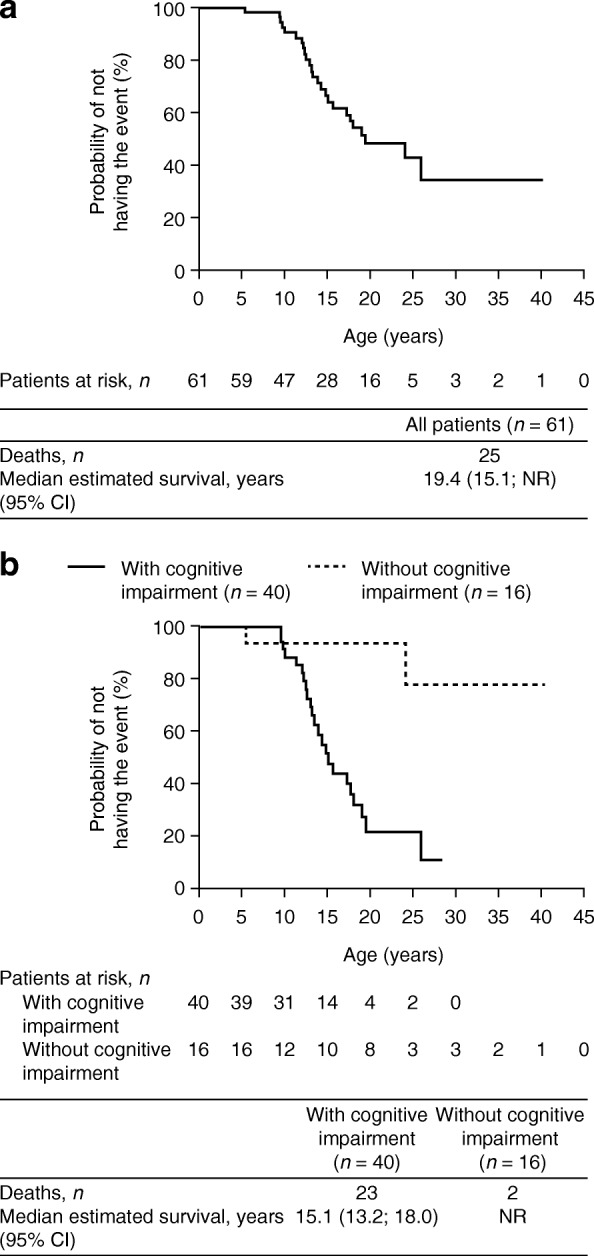
Fig. 3.

Survival in the overall population and according to cognitive impairment. Kaplan–Meier survival analysis for (a) all patients in the overall population (N = 61) and (b) patients in the overall population with and without cognitive impairment (n = 40 and n = 16, respectively). The overall population contains both prospective and retrospective patients. CI, confidence interval; NR, not reached
