
FIGURE 1.
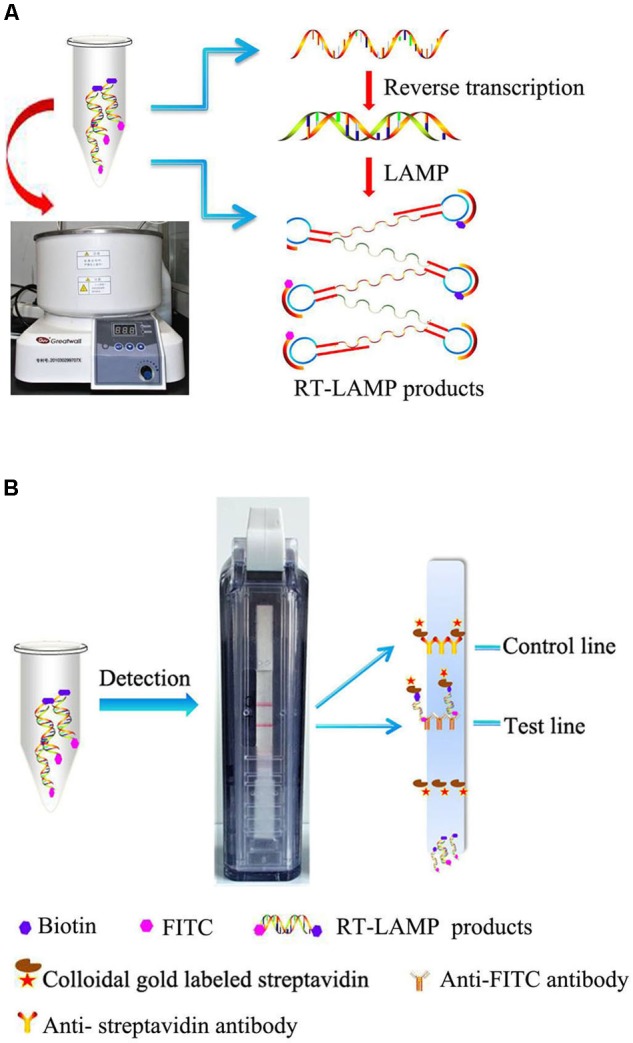
Schematic illustration of the RT-LAMP-VF assay. (A) RT-LAMP was performed in a constant temperature water bath. (B) RT-LAMP products were detected with a vertical flow visualization strip.
Official websites use .gov
A
.gov website belongs to an official
government organization in the United States.
Secure .gov websites use HTTPS
A lock (
) or https:// means you've safely
connected to the .gov website. Share sensitive
information only on official, secure websites.
Schematic illustration of the RT-LAMP-VF assay. (A) RT-LAMP was performed in a constant temperature water bath. (B) RT-LAMP products were detected with a vertical flow visualization strip.