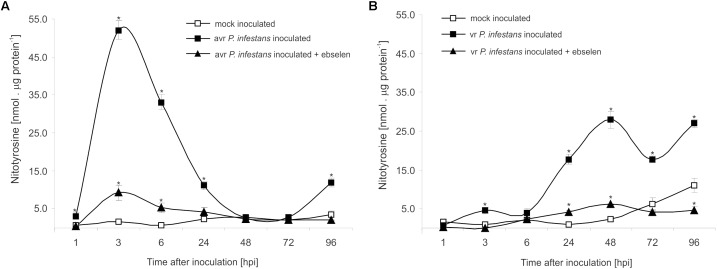
FIGURE 4.
Quantification of protein tyrosine nitration in leaves of resistant (A) and susceptible (B) potato inoculated with P. infestans. Analyses were performed at 1, 3, 6, 24, 48, 72, and 96 h after challenge inoculation. Values represent the mean ± SD of at least three independent experiments (n = 9). Asterisks indicate values that differ significantly from mock inoculated (control) potato leaves at ∗P < 0.05.

