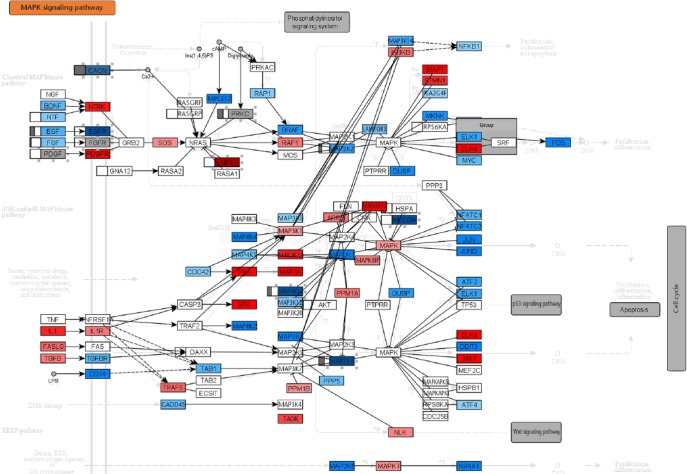
Fig. 3.
Diagram of the mitogen-activated protein kinase signalling pathway. Rectangular nodes correspond to genes or gene families and their colour indicates mRNA expression (blue means downregulated, red means upregulated). The box to the left of those nodes indicates promoter DNA methylation. The largest peak is shown and an empty box indicates no differential methylation. The bar to the left indicates hypomethylation and the bar which goes from the middle of the box to the right indicates hypermethylation. Small rectangular boxes below the mRNA nodes indicate protein and protein modification expression. Each of those boxes is red, which indicates upregulation.

