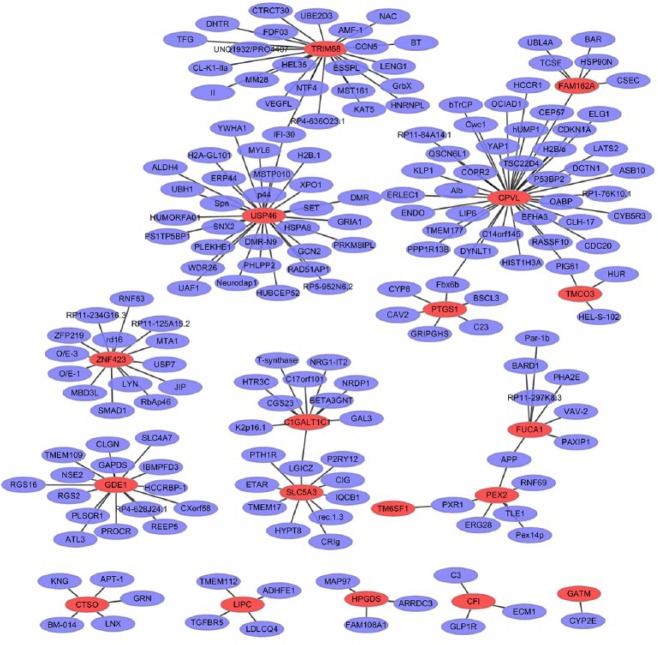
Fig. 5.
The protein-protein interaction (PPI) networks of the top 20 upregulated differentially expressed genes (DEGs). All the nodes are proteins encoded by DEGs and the red borders represent proteins encoded by the top 20 upregulated DEGs; purple borders represent proteins encoded by other genes that interacted with proteins encoded by these DEGs.

