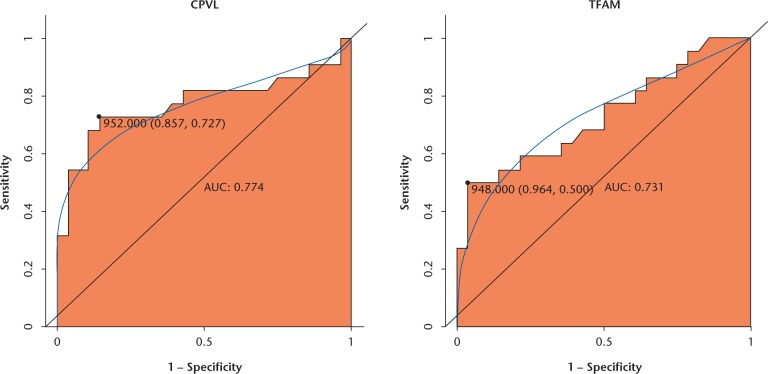
Fig. 9.
Receiver operator characteristic (ROC) curves of selected differentially expressed genes (DEGs) between osteoarthritic patients and healthy controls. The ROC curves were used to show the diagnostic ability of these selected DEGs with 1-specificity (the proportion of false positive) and sensitivity (the proportion of true positive).

