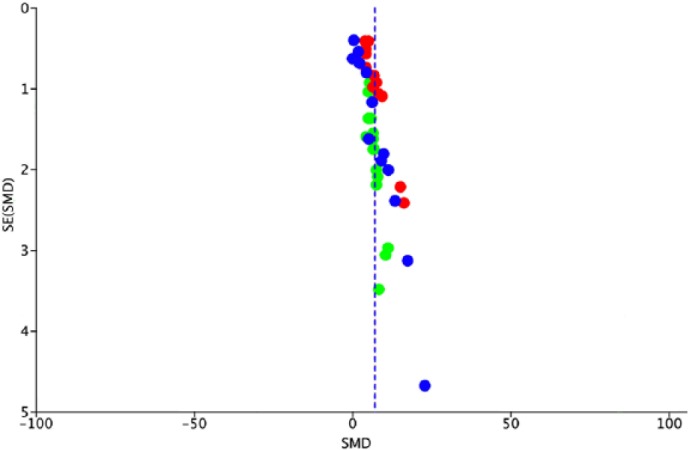
Fig. 3.

Funnel plot analysis for the publication bias of maximum load (blue), maximum stress (green), and Young’s modulus (red) outcomes. Funnel plot analysis indicated a low likelihood of publication bias.

Funnel plot analysis for the publication bias of maximum load (blue), maximum stress (green), and Young’s modulus (red) outcomes. Funnel plot analysis indicated a low likelihood of publication bias.