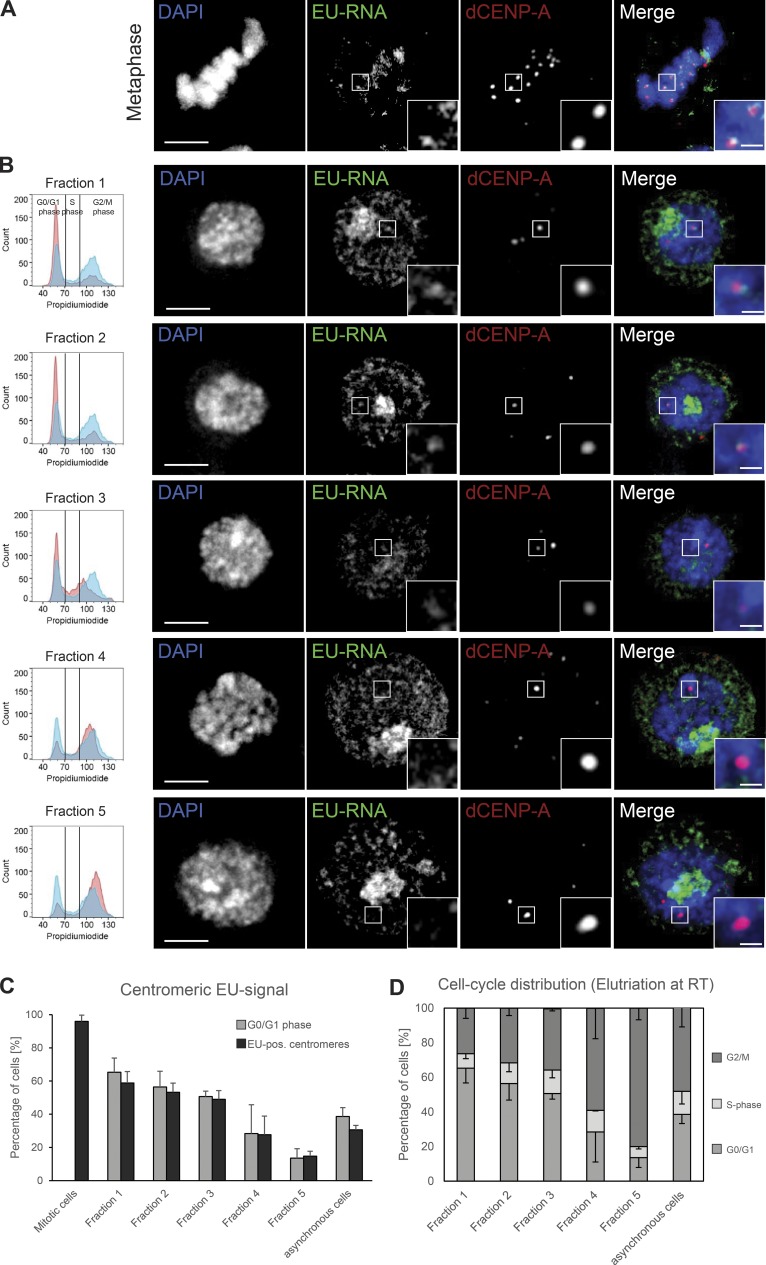
Figure 2.
Nascent RNA transcripts are present at mitotic and interphase centromeres. (A and B) Fixed S2 cells immunostained for dCENP-A as a marker for centromeres. Bar, 3 µm. Boxes indicate the 3× enlarged inset (bar, 0.5 µm). (A) Maximum-intensity projection of metaphase cell with nascent RNA production labeled by EU incorporation. (B) Single optical section of cells elutriated into fractions to enrich for cells in G1 (fractions 1–3) and G2/M (fractions 4 and 5). Nascent RNA production was labeled by EU incorporation. The respective FACS profile for each fraction (red) in comparison to nonelutriated cells (blue) is shown in the left column. (C) Graph displaying the correlation between the amount of G1 cells and the cells that showed EU-RNA–positive centromeres in all elutriation fractions, mitotic cells, and asynchronous growing cultures. n = 3 replicates; n = 30–100 cells; data are mean + SD. (D) Graph depicting the presence of the various cell populations in the elutriation fractions and asynchronous growing cultures. Elutriation was performed at RT; data were extracted from FACS profiles for each fraction (see also left column of B). n = 3 replicates; data are mean − SD.

