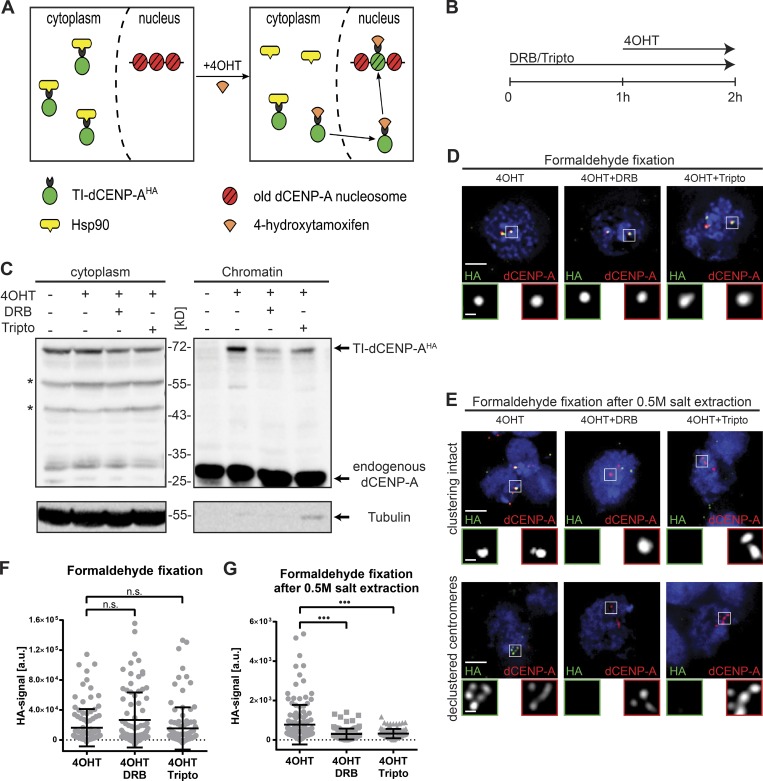
Figure 3.
Transcriptional inhibition prevents stabilization of correctly targeted new dCENP-A. (A) Schematic illustration of the tamoxifen-mediated release of TI-dCENP-AHA. (B) Experimental setup used in C–G and Figs. 4, 5 (D and E), 6, S3, and S4 (B–D). (C) Western blot analysis showing the impaired loading of new dCENP-A into chromatin after transcriptional inhibition. Arrows mark protein of interest, and asterisks mark unspecific bands or potential degradation products. Endogenous dCENP-A (chromatin) and tubulin (cytoplasm) serve as markers for the two fractions. (D) Maximum-intensity projection of cells stably expressing TI-dCENP-AHA fixed in formaldehyde. Respective treatments are indicated above each picture. Bar, 3 µm. 3× magnification of boxed area is shown below (TI-dCENP-AHA [green] and total dCENP-A [red]; bar, 0.5 µm). (E) Maximum-intensity projection of cells stably expressing TI-dCENP-AHA fixed in formaldehyde after 30 min of 0.5 M salt extraction. Cells with clustering of centromeres still intact (upper panel) and disrupted (lower panel) are shown. Respective treatments are indicated above the pictures. Bars, 3 µm. 3× magnification of boxed area is shown below (TI-dCENP-AHA [green] and total dCENP-A [red]; bar, 0.5 µm). (F and G) Quantification of centromeric HA-signal/cell from pictures shown in D (F) or E (G). n = 3 replicates, n = 30–50 cells. Data are mean ± SD. The p-value was determined using the Kolmogorov–Smirnov test. •••, P ≤ 0.001.

