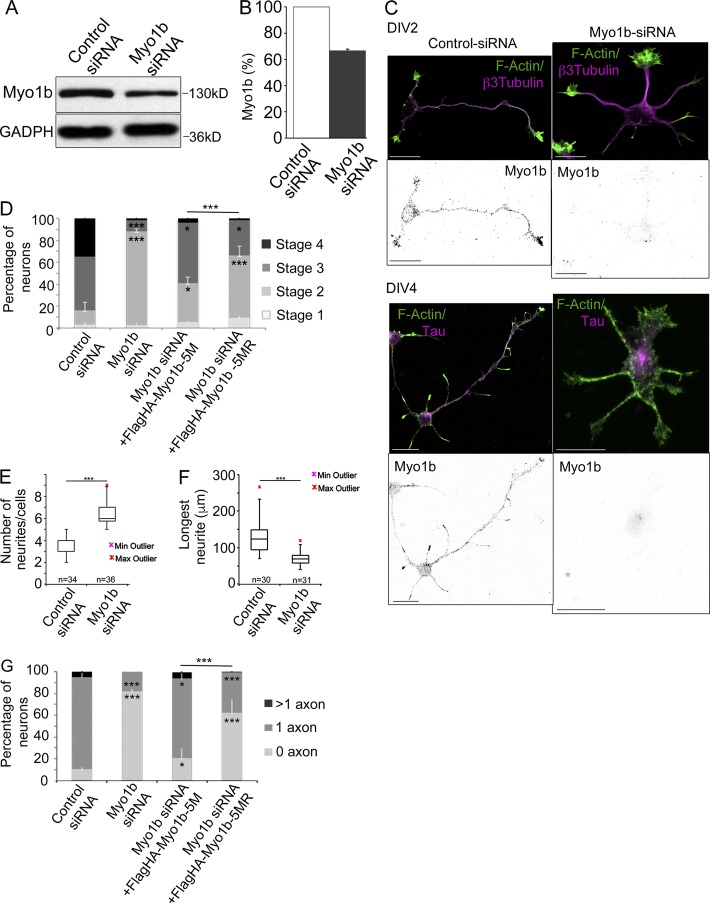
Figure 2.
Depletion of Myo1b delays neuronal differentiation and inhibits the formation of axon. (A) 48 h after transfection with control or Myo1b-siRNAs, lysates of cortical neurons were analyzed by SDS-PAGE and immunoblotting with anti-Myo1b antibodies. GAPDH was used as loading control. (B) The amount of Myo1b was quantified and normalized to the amount of GAPDH. Data are shown as a mean of three experiments. (C) Cortical neurons were transfected with control or Myo1b-siRNAs, fluorescently labeled for F-actin, and immunolabeled for Myo1b and β3-tubulin at DIV2 or Tau-1 at DIV4. Representative confocal z stacks for Myo1b and merged confocal z stacks for F-actin (green) and β3-tubulin or Tau-1 (magenta) are shown. Bars, 20 µm. (D) The percentages of neurons showing each of the different stages of differentiation were quantified for neurons transfected with control siRNAs, Myo1b-siRNA, Myo1b-siRNA+Flag-HA-Myo1b5M, and Myo1b-siRNA+Flag-HA-Myo1b5MR based on their morphologies observed at DIV2 after immunolabeling for β3-tubulin and fluorescently labeled for F-actin. Data are shown as the mean of three independent experiments for each condition. Error bars represent ± SEM. n = 30 cells/experiment. (E) The number of neurites per cell was quantified in cortical neurons transfected with control siRNA or Myo1b-siRNA at DIV2 and represented as box plots. n = 3 independent experiments; n = 30 cells/experiment. (F) The length of the longest neurite in cortical neurons transfected with control siRNA or Myo1b-siRNA was measured at DIV2 and represented as box plots. n = 3 independent experiments; n = 30 cells/experiment. (G) The percentages of neurons with none, single, and multiple axons were quantified after transfection of control and Myo1b-siRNAs, Myo1b-siRNA+FlagHA-Myo1b-5M, or Myo1b-siRNA+FlagHA-Myo1b-5MR and immunolabeling at DIV4 for Tau-1 to identify nascent axons. Data are shown as the mean of three independent experiments for each condition. Error bars represent ± SEM. n = 30 cells/experiment. Data distribution was assumed to be normal. χ2 test (D and G); unpaired t test (F and G). *, P < 0.05; **, P < 0.01; ***, P < 0.0001.

