Figure 6.
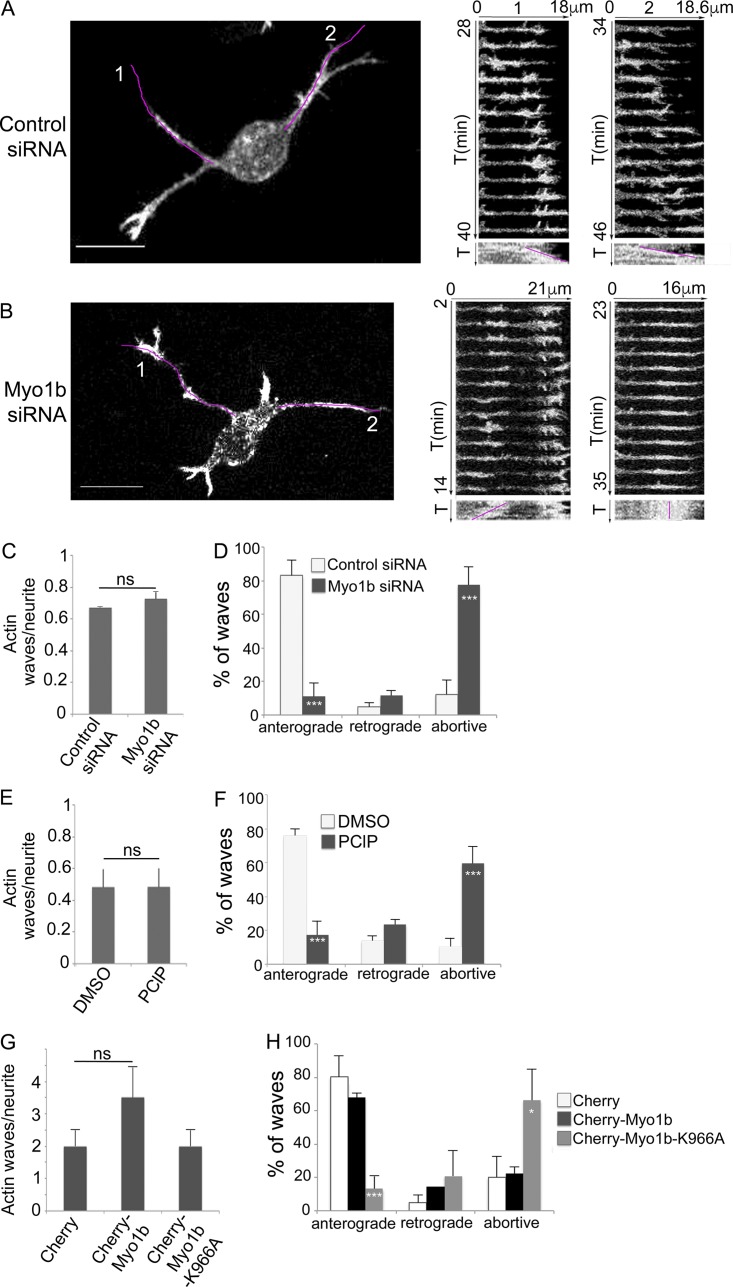
Myo1b, its motor activity, and its PH motif control the anterograde propagation of actin waves. (A and B) The propagation of actin waves has been analyzed in cortical neurons transfected with control (A) or Myo1b-siRNAs (B) at DIV1 by time-lapse spinning confocal microscopy (see also Video 3, a and b). Images of the first frame and the kymographs of the Video 6 (a and b) for the region marked by a purple lane on the first frames for 13 min are shown (time lapse, 1 min). T, time. Two anterograde waves are observed in control cells (A1 and A2), whereas in Myo1b-depleted neurons, actin waves are formed, but they either migrate to the cell body (retrograde; B1) or oscillate and collapse along the shaft of neurite (B2). Bars, 10 µm. (C and D) Ratio of actin waves per neurite (C) and anterograde, retrograde, and abortive actin waves normalized to the total number of waves (D) observed by time-lapse spinning confocal microscopy in cells cotransfected with LifeAct-EGFP and control or Myo1b-siRNA. Data are shown as the mean of three independent experiments for each condition. n = 13, 9, and 6 cells for control siRNA treatment; n = 9, 8, and 3 cells for Myo1b-siRNA treatment per experiments. (E and F) Ratio of actin waves per neurite (E) and anterograde, retrograde, and abortive waves normalized to the total number of waves (F) observed by time-lapse spinning confocal microscopy in cells transfected with LifeAct-EGFP and treated with DMSO or PClP. Data are shown as the mean of three independent experiments for each condition. n = 8, 15, and 16 cells for DMSO treatment; n = 11, 17, and 7 for PClP treatment per experiment. (G and H) Ratio of actin waves/neurite (G) and anterograde, retrograde, and abortive actin waves normalized to the total number of waves (H) observed in neurons transfected with LifeAct-EGFP together with mCherry, mCherry-Myo1b, or mCherry-Myo1b-K966A. Data are shown as the mean of three independent experiments for each condition. Error bars represent ± SEM. n = 6, 10, and 7 cells expressing mCherry; n = 7, 11, and 10 cells expressing mCherry-Myo1b; n = 11, 8, and 8 cells expressing mCherry-Myo1b-K966A per experiment. Data distribution was assumed to be normal. χ2 test. *, P < 0.05; ***, P < 0.001.

