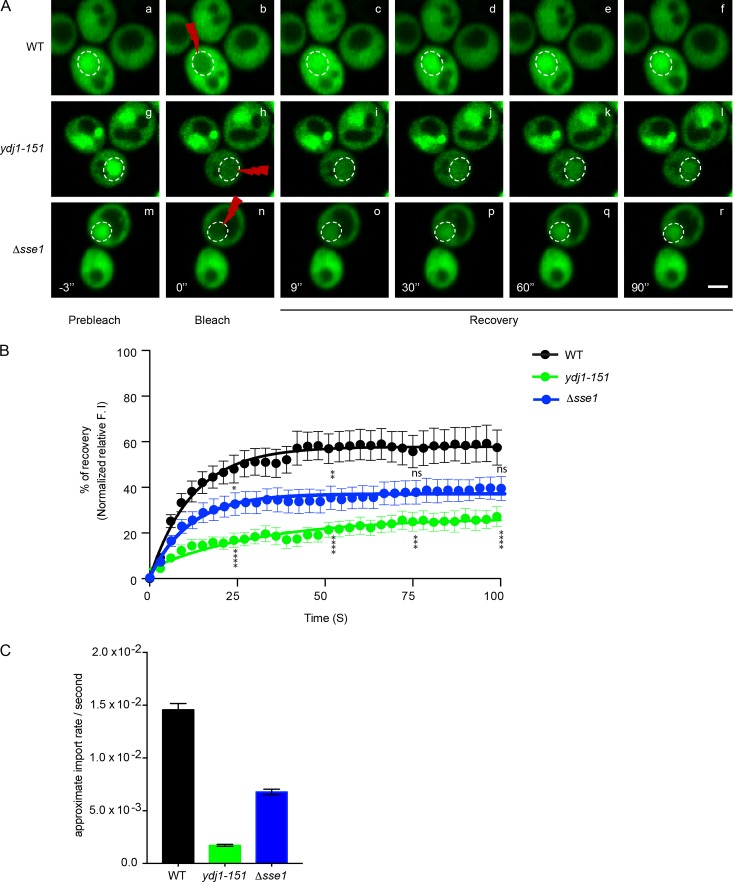
Figure 3.
Misfolded protein nuclear trafficking is defective in YDJ1 and SSE1 mutants. (A) Nuclear import of sf-Δ2GFP in WT, ydj1-151, and Δsse1 cells was analyzed by FRAP. Nuclei were photobleached (100% 488-nm laser transmission; 15–20 iterations) after three images, and recovery was monitored by acquiring images immediately after bleaching (postbleach). Images show cells before bleaching (prebleach), immediately after bleaching (0 s), and 9, 30, 60, and 90 s after the initial bleach (postbleach). Dashed circles indicate positions of bleached nuclei. Bars, 2 µm. (B) The recovery of nuclear localized sf-Δ2GFP was plotted over the time. The fluorescence intensity (F. I.) of sf-Δ2GFP was quantified using ImageJ. Unpaired t test: *, P < 0.033; **, P < 0.002; ***, P < 0.0002; ****, P < 0.0001. n = 10. (C) Import rates were calculated using a pseudo–first order association kinetics curve using the model equation Y = Y0 + (Yindef − Y0) × [1 − e(−K × t)]. n = 10. The result shown is representative of three independent experiments. Error bars indicate means ± SEM.

