Figure 6.
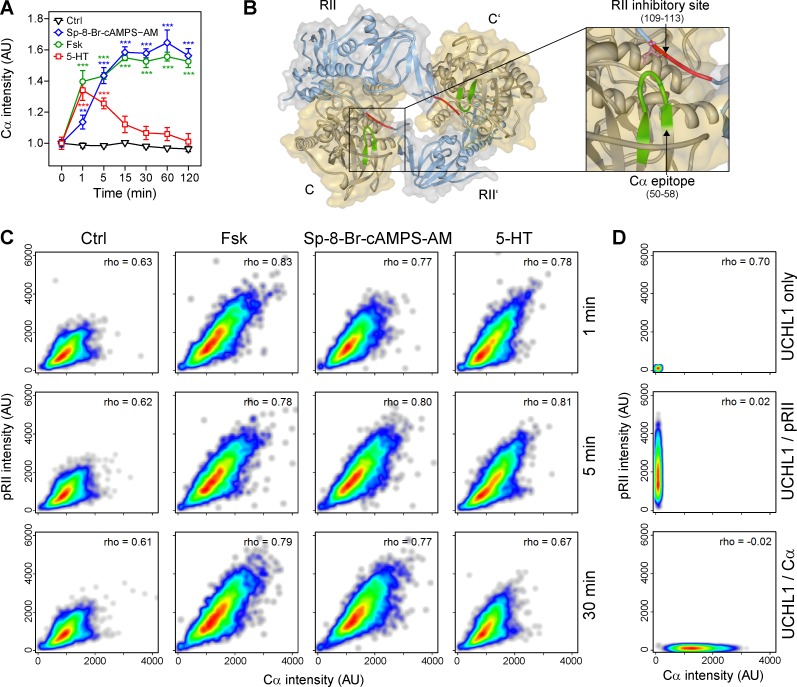
Antibodies binding the glycine-rich loop of C-subunits present a cAMP-dependent intensity pattern in sensory neurons. (A) Time course of Cα intensity after stimulation with Ctrl (0.1% DMSO), 10 µM Fsk, 10 µM Sp-8-Br-cAMPS-AM, or 200 nM 5-HT. (B) Nano–LC-MS/MS was applied to map the epitope of the Cα-specific antibody. The antibody binds to the sequence GTGSFGRVM corresponding to aa 50–58 of C-subunits. This region contains the glycine-rich loop and is localized face to face with the pRII site in the holoenzyme structure (Protein Data Bank accession no. 3TNP; Zhang et al., 2012). (C) Cell density plots showing single-cell data of pRII/Cα–labeled neurons stimulated for 1, 5, or 30 min with 10 µM Fsk, 10 µM Sp-8-Br-cAMPS-AM, or 0.2 µM 5-HT. The Spearman’s rank correlation coefficient is shown. (D) Controls indicating that spillover between fluorescence channels was properly compensated to avoid false correlations. HCS results in A show means ± SEM; n = 3–4; >1,000 neurons/condition; two-way ANOVA with Bonferroni’s test. ***, P < 0.001. Kinetic experiments are plotted in nonlinear scale.

