Figure 8.
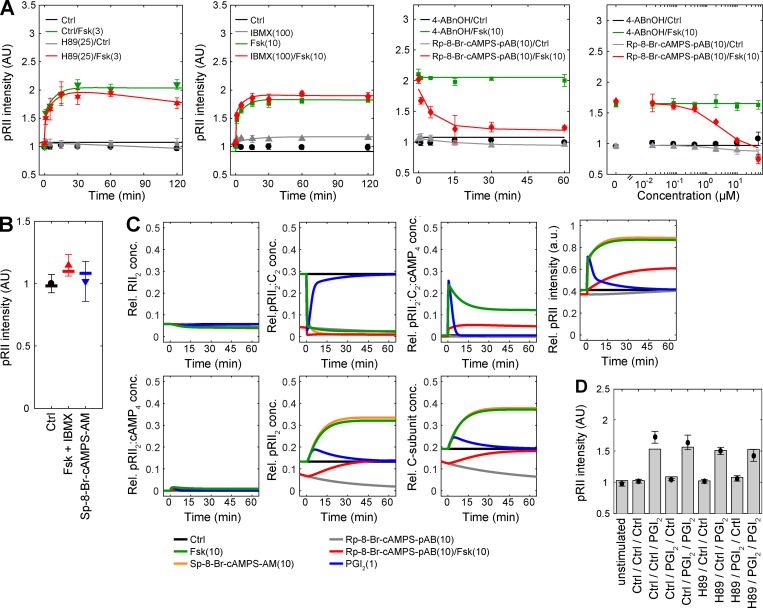
Mechanistic mathematical modeling describes the experimental data for PKA-II activation. (A) Comparison of experimental data obtained by immunostaining of intact neurons with simulation results for the best model. Experimental data for H89 are also included in Fig. 1 H, for IBMX in Fig. S1, and for Rp-8-Br-cAMPS-pAB in Fig. 4 (C and F). The good agreement indicates the consistency of the best model assumptions. (B) Comparison of experimental data obtained by Western blotting with simulation results. (C) Prediction of the dynamics of selected internal states of the best model. (D) Experimental data for repetitive PGI2 treatment (black data points) and the corresponding model predictions (gray bars) for an assumed PGI2 half-life time of 90 s. Sensory neurons were pretreated for 30 min with 25 µM H89 or solvent (DMSO, 0.1%) followed by stimulation with 1 µM PGI2 for 60 min and then again for 2 min. HCS results in A represent means ± SEM; n = 3–4; >1,000 neurons/condition. Immunoblot results in B represent mean ± SD; n = 6.

