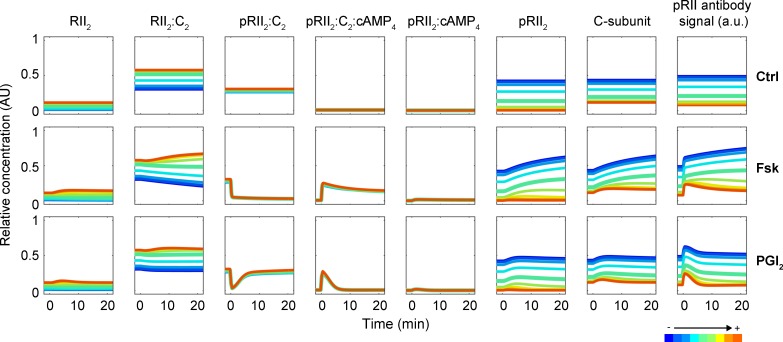
Figure 9.
Phosphatase activity decreases dissociation of PKA-II at baseline and after stimulation. The effect of increasing phosphatase activity on the internal states of the best model after stimulation with Fsk or PGI2 is shown. Different colors indicate phosphatase activities ranging from a 100-fold reduction (blue lines) to a 100-fold increase (red lines) compared with the estimated phosphatase activity (green lines).

