Figure 1.
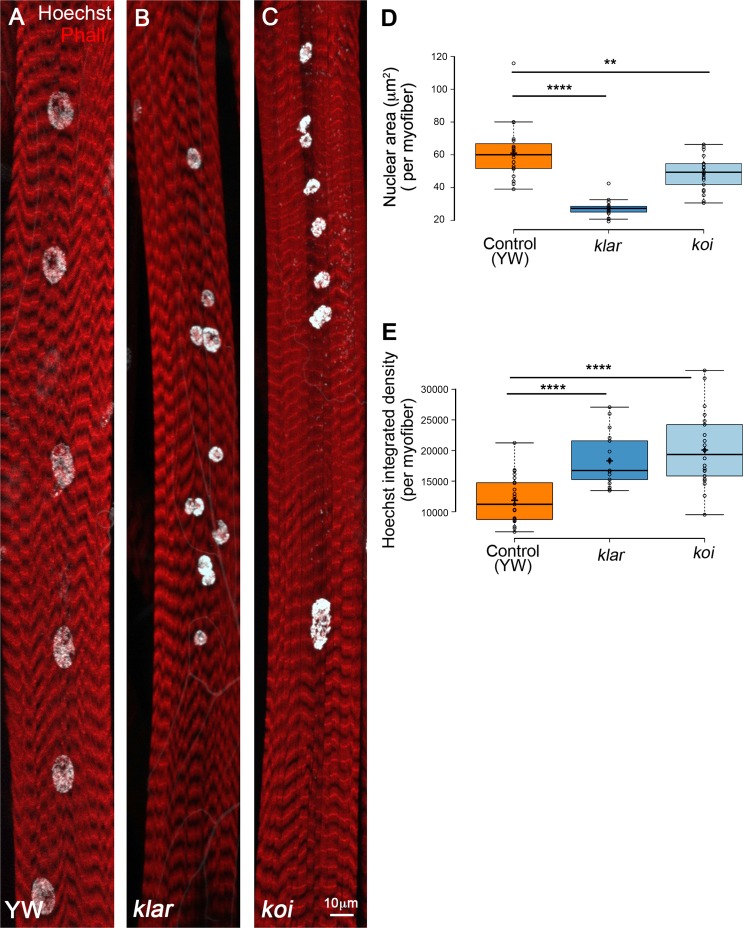
LINC mutant myonuclei are smaller and contain increased DNA content. Representative projected confocal images of muscle 7 from third-instar larvae of control (A; yw), klar (B), or koi (C) null mutants, labeled with Phalloidin (red) and Hoechst (white). Bar, 10 µm. (D) Quantitative analysis of the nuclear area of control, klar or koi myonuclei. Each dot represents the mean nuclear area value of all myonuclei in an individual myofiber. The myonuclear area of klar and koi are both significantly smaller than control (unpaired t test: ****, P = 10−10; **, P = 0.0039). (E) Quantitative analysis of Hoechst integrated density of control, klar, and koi myonuclei. Each data point represents the mean Hoechst integrated density value of all myonuclei of an individual myofiber 7. klar and koi myonuclei contain more DNA than control (unpaired t test: ****, P ≤ 10−6). Whiskers in D and E extend to data points less than 1.5 interquartile ranges from the first and third quartiles. Images were taken from six distinct larvae (control, n = 23; klar, n = 18; koi, n = 22).

