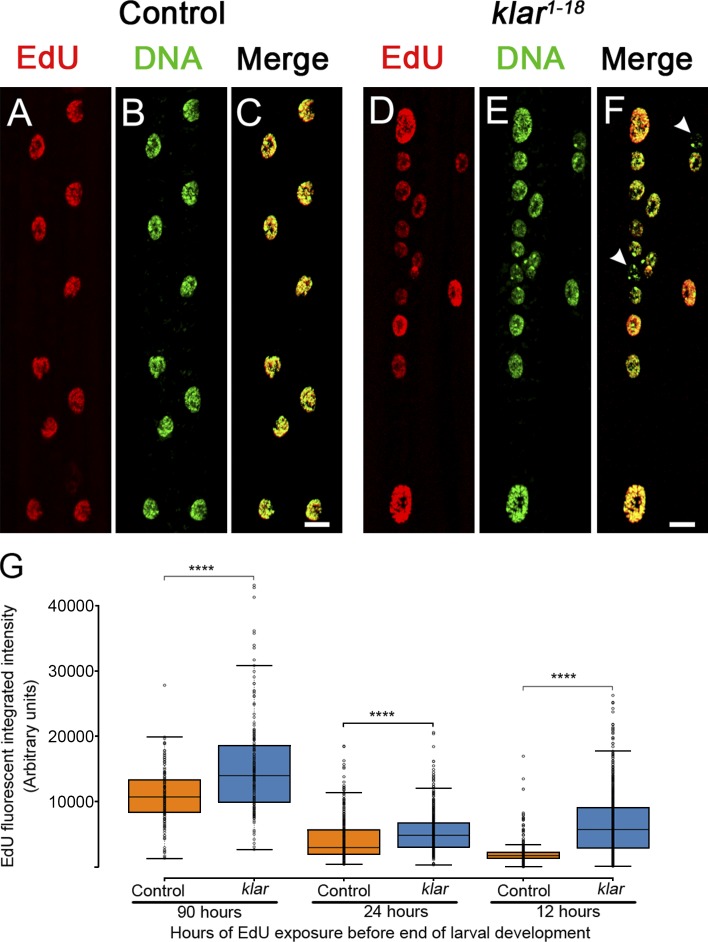
Figure 2.
Impaired synchronization of DNA replication and dysregulated cell-cycle progression in klar mutant myonuclei. (A–F) Representative images of EdU incorporation (after EdU feeding for 48 h from early-second to the late-third instar larval stages) in WT (control) (A–C) or klar mutant muscle 6 (D–F) indicated by EdU labeling (red) and DAPI (green) labeling. All nuclei in a specific WT muscle fiber are approximately equally labeled, whereas in klar mutant myonuclei EdU labeling is variable (white arrowheads in F show an EdU-negative nucleus). Bars, 10 µm. (G) Quantification of EdU integrated density of EdU (fluorescence signal) in control (orange) and klar mutant (blue) myonuclei in muscle 7 after EdU feeding of 90, 24, or 12 h of larval development in staged larvae. Each data point represents a single nucleus. klar mutant myonuclei incorporated more EdU in all incubation periods (unpaired t test: ****, P ≤ 6 × 10⁻⁷). For 90 h: control, n = 158 and klar, n = 174 myonuclei; for 24 h: control, n = 377 and klar, n = 760; for 12 h: control, n = 568 and klar, n = 760; for all samples four muscles from six distinct larvae were analyzed. Whiskers extend to data points less than 1.5 interquartile ranges from the first and third quartiles.

