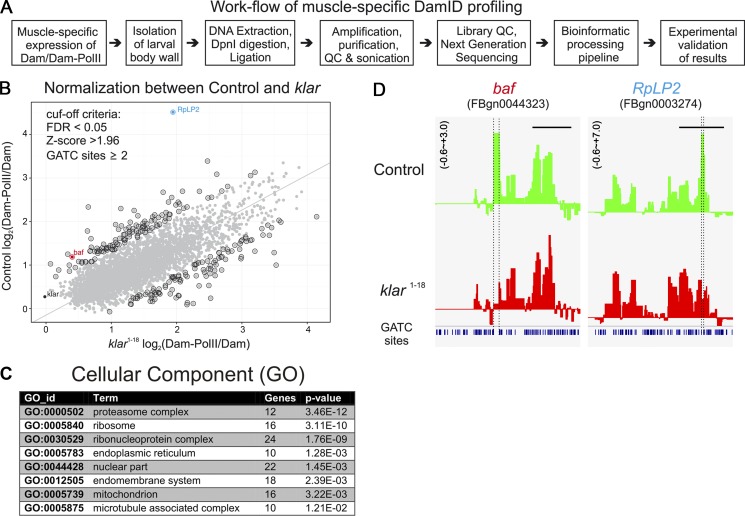
Figure 6.
Profiling of Dam-RNA-Pol II genome occupancy in WT and klar mutant muscles. (A) Flow chart of the experimental procedures for the muscle-specific Dam-Pol II profiling. (B) Normalization of the high-throughput data by using a regression analysis between WT and the klar mutant. Gray dots in the plot represent single genes identified in the muscle-specific targeted Dam-Pol II occupancy. By setting the cut-off criteria false discovery rate (FDR) <0.05 and z-score >1.96 and focusing on more than one Dam-methylation site, the positive hits are highlighted by a black circle. The gene with highest z-score RpLP2 as well as klar are separately labeled. Principal component analysis was performed on a matrix composed of the x and y axis as features of the points. The axis was rotated to the principle components and derives the line that passes through the main axis of variation. This line puts equal weights to the x and y axes, but it is not restricted to pass through the origin. (C) GO analysis of the Dam-RNA-Pol II hits. (D) Two examples of the binding profiles of Dam-Pol II to baf and RpLP2 genes.

