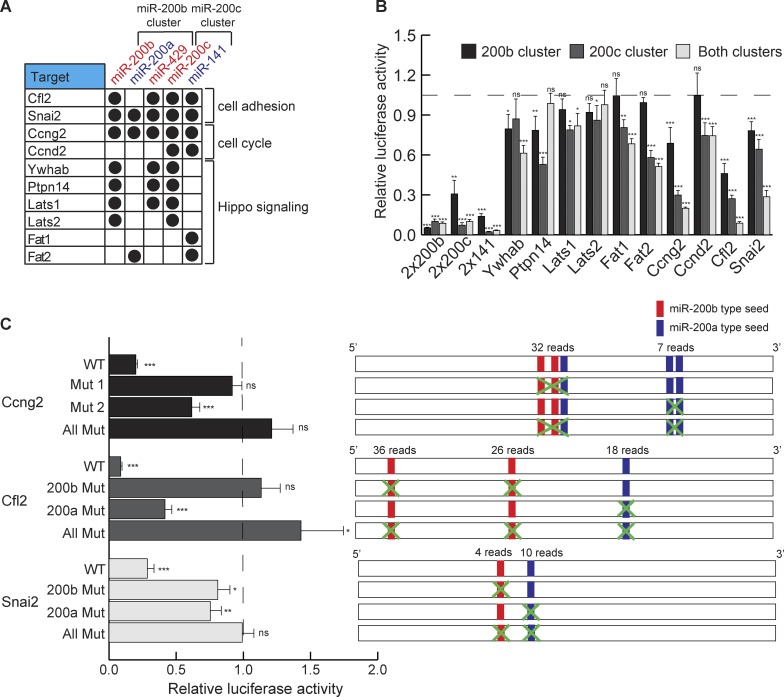
Figure 3.
miR-200 members cooperate in repressing targets. (A) Genes identified as miR-200 family targets with specific miR-200 interactions. (B) Relative luciferase activity of 3′ UTRs from targets with expression of the miR-200b cluster, the miR-200c cluster, or both. The dashed line represents luciferase activity with no miR-200s; n = 6. (C) Relative luciferase activity of WT or mutated 3′ UTRs with expression of both miR-200 family clusters in dKO cells. Construct design for mutations is shown in the right panel. The dashed line represents luciferase activity with no miR-200s. n = 6. *, P < 0.05; **, P < 0.01; ***, P < 0.001; Student’s two-tailed t test; error bars are SD.

