Figure 4.
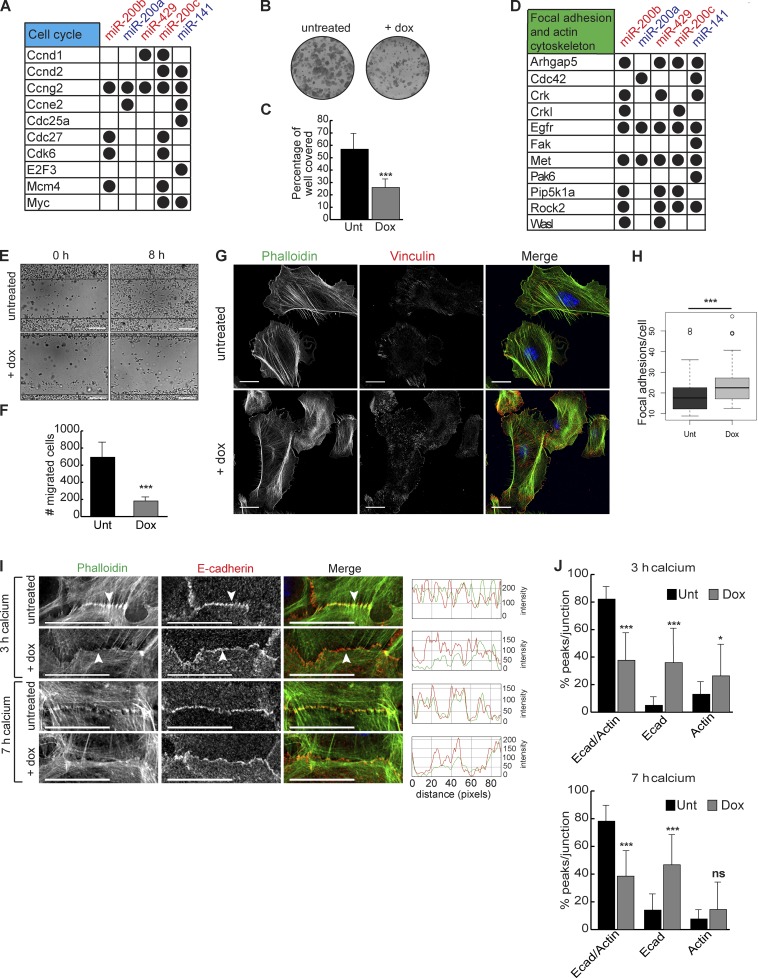
miR-200 overexpression represses proliferation and migration and affects FA and AJ formation. (A) miR-200 targets involved with cell cycle. (B and C) Colony formation assay of Tg keratinocytes untreated (Unt) or treated with doxycycline (Dox). n = 6. (D) miR-200 targets involved with FA and actin cytoskeleton. (E) Scratch assay on Tg keratinocytes untreated or treated with doxycycline 0 or 8 h after scratching. (F) Number of cells migrated in E. n = 3. (G and H) Immunofluorescence and quantification of vinculin and phalloidin stain for actin on Tg keratinocytes untreated or treated with doxycycline. n = 76 untreated; n = 77 doxycycline treated. (I) Immunofluorescence of E-cadherin (Ecad) and phalloidin staining for actin on Tg keratinocytes untreated or treated with doxycycline and induced with calcium for 3 or 7 h. Arrowheads indicate actin localization to E-cadherin. Red-green-blue (RGB) line scans over 90 pixels across each cell junction. Representative images from n > 20 cell junctions imaged for each treatment. (J) Percentage of peaks per junction shared between E-cadherin and actin or exclusive to E-cadherin or actin treated as in I. 3-h untreated, n = 21; 3-h doxycycline, n = 23; 7-h untreated, n = 19; 7-h doxycycline, n = 26. *, P < 0.05; ***, P < 0.001; Student’s two-tailed t test; error bars are SD. Bars: (E) 100 µm; (G and I) 20 µm.

