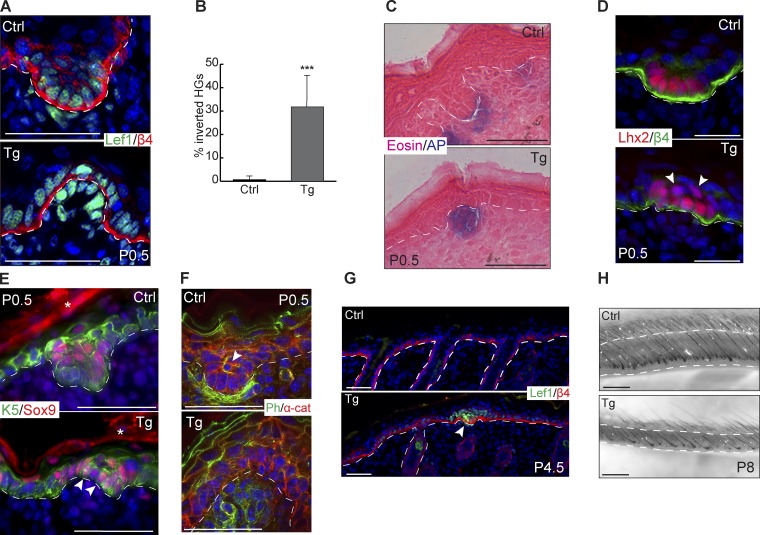
Figure 7.
miR-200 overexpression causes evaginated HGs. (A) Immunofluorescence of Lef1 and β4-integrin on control and Tg HGs at P0.5. (B) Percentage of control and Tg HGs with evaginated appearance. ***, P < 0.001; Student’s two-tailed t test; error bars are SD. (C) Alkaline phosphatase and eosin staining on control and Tg back skin at P0.5. (D) Immunofluorescence of Lhx2 and β4-integrin on control and Tg HGs at P0.5. Arrowheads indicate suprabasal Lhx2+ cells. (E) Immunofluorescence of Sox9 and Krt5 on control and Tg HGs at P0.5. Arrowheads indicate mislocalized Sox9+ cells, and asterisks indicate nonspecific secondary antibody staining. (F) Immunofluorescence of α-catenin with phalloidin stain for actin on control and Tg HGs at P0.5. The arrowhead indicates an actin bundle in central suprabasal cell. (G) Immunofluorescence of Lef1 and β4-integrin on control and Tg back skin at P4.5. The arrowhead indicates arrested HG. (H) Brightfield images of whole-mounted control and Tg back skin at P8. All images representative from n = 6 pairs of animals except for P4.5 (n = 3) and P8 (n = 1 because of neonatal lethality). Bars: (A and C–F) 50 µm; (G) 100 µm; (H) 500 µm.

