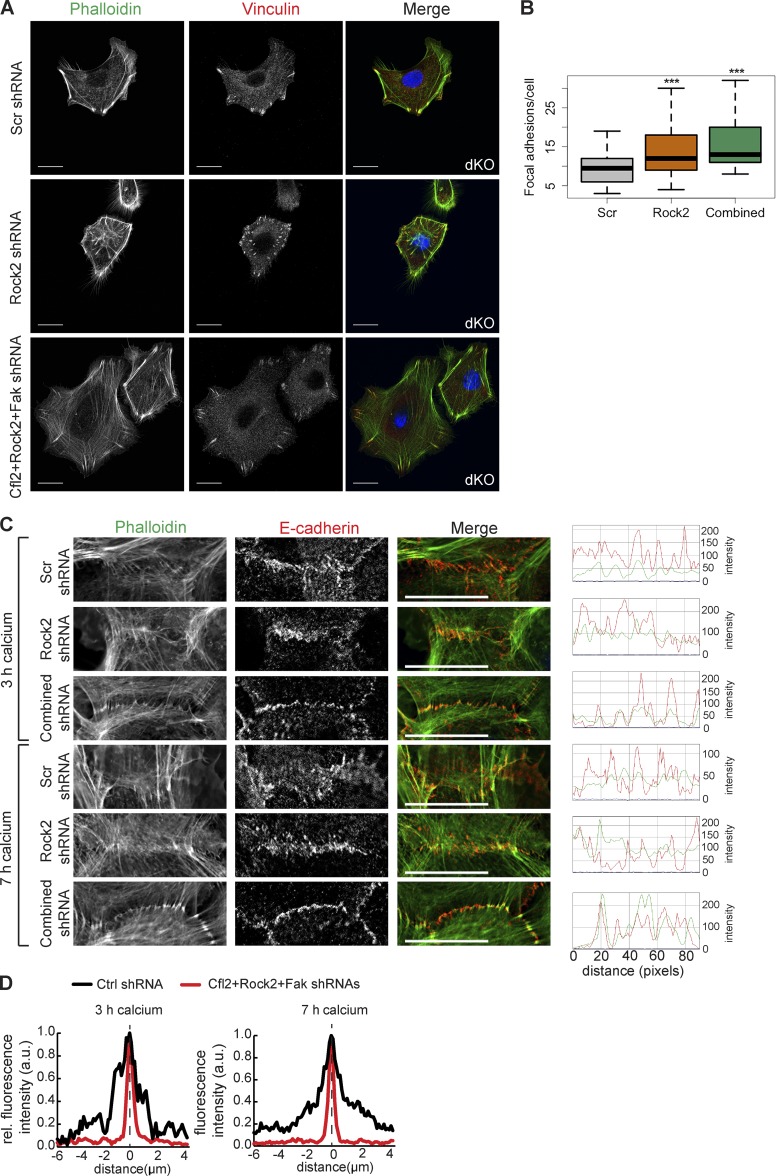
Figure 9.
Simultaneous KD of multiple miR-200 targets in dKO cells rescues FA and cell junction phenotypes. (A) Immunofluorescence of vinculin and phalloidin stain for actin on dKO keratinocytes infected with Scr, Rock2, or a combination of Rock2, Cfl2, and Fak shRNAs. (B) Number of FAs per cell in A. n = 42 Scr; n = 25 shRock2; n = 42 combined. (C) Immunofluorescence of E-cadherin and phalloidin staining for actin on dKO keratinocytes infected with Scr, shRock2, or a combination of Cfl2, Rock2, and Fak shRNAs and induced with calcium for 3 or 7 h; line scans over 90 pixels across each cell junction; representative images from n > 20 cell junctions imaged for each treatment. (D) Mean fluorescence intensity of E-cadherin across cell junction. Distance of 0 and dashed line indicate center of junction. 3-h Scr, n = 10; 3-h combined, n = 28; 7-h Scr, n = 18; 7-h combined, n = 38; normalized to maximum intensity for each condition. *, P < 0.05; Student’s two-tailed t test. Bars, 20 µm.

