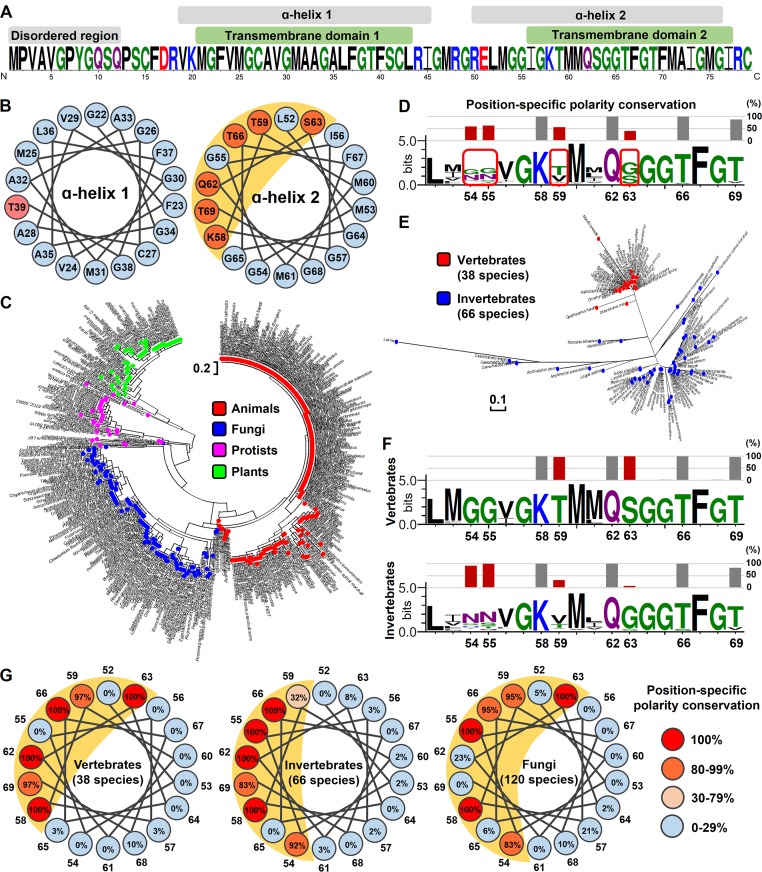
Figure 1.
Secondary structure analysis of Romo1 in eukaryotes. (A) Secondary structure prediction of H. sapiens Romo1. The Romo1 sequence was described using the WebLogo 3 server. The indicated secondary structures were predicted using JPRED (α-helix), HMMTOP (TMDs), and DISOPRED (disordered region). (B) α-Helical wheel of H. sapiens Romo1. Illustrations were recreated based on results from the Helical Wheel Projections server. Blue, nonpolar amino acids; red, polar amino acids. (C) Phylogenetic relationships of Romo1. A phylogenetic tree was built from 460 Romo1 amino acid sequences using the maximum likelihood method based on the JTT matrix–based model. Evolutionary analyses were performed using MEGA7 software. Blue, fungi; green, plants; red, animals; purple, protists. (D–F) Analysis of position-specific polarity conservation. Multiple sequence alignments of nonidentical Romo1 sequences from 104 animal species to determine position-specific polarity conservation (D). Numbers below sequences represent the amino acid position of H. sapiens Romo1 based on the results of multiple sequence alignment. Position-specific polarity was calculated as the ratio of conservation of polar amino acids at the indicated position, and bars represent the conservation percentage of polar amino acids. The phylogenetic tree was built with 104 nonidentical sequences using the maximum likelihood method based on the JTT matrix–based model (E). The 104 nonidentical sequences were classified as originating from vertebrates or invertebrates to determine position-specific polarity conservation (F). (G) α-Helical wheel of position-specific polarity conservation in animal and fungal species. Numbers around the α-helical wheel represent the amino acid position of H. sapiens Romo1.

