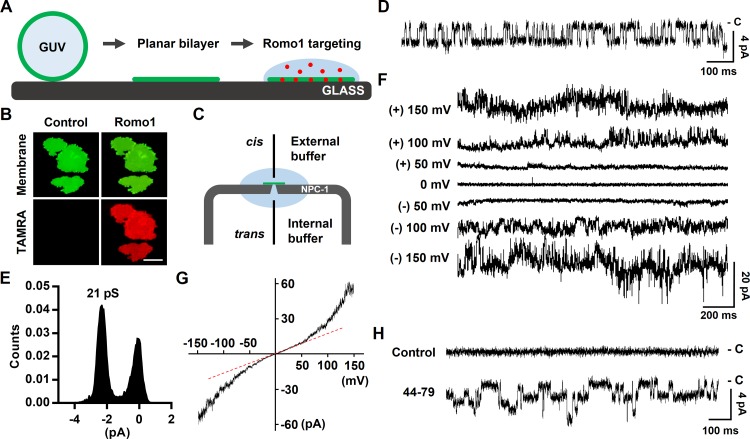
Figure 4.
Measurement of the ion channel activity of Romo1. (A) Illustration of planar bilayer formation and Romo1 targeting. (B) Romo1 targeting to the planar bilayer. GUVs (8:1:1 DPhPC/DPhPG/cholesterol molar ratio) were used to form a planar bilayer in a glass chamber filled with 150 mM KCl and 10 mM Hepes/Tris, pH 7. TAMRA-Romo1 (in 1 M sorbitol) was overlaid onto the planar bilayer for 5 min, after which the bilayer was washed with 150 mM KCl and 10 mM Hepes/Tris, pH 7. Images were captured using a fluorescence microscope. Bar, 40 µm. (C) Illustration of the NPC-1 chip used in the Port-a-Patch system. External and internal buffers were the same, i.e., 150 mM KCl and 10 mM Hepes/Tris, pH 7. Gray, NPC-1 chip; green, planar bilayer, pale blue; internal and external buffers. (D–F) Bilayer patch clamp assay of Romo1. Romo1 (in 1 M sorbitol) was added to a preformed planar bilayer, and a voltage of −120 mV was applied. Activities were then monitored. D shows the single channel current at −120 mV and E shows histogram of single channel conductance of Romo1. (F) Macroscopic currents using a step protocol from −150 to 150 mV were recorded. (G) I–V relationship of macroscopic currents. Currents from a ramp protocol from −150 to 150 mV (2-s duration) were averaged from five sweeps and plotted on the I–V curve. (H) Ion channel activity of the 44–79 region of Romo1. Control data were acquired before treatment with 44–79.

