Figure 1.
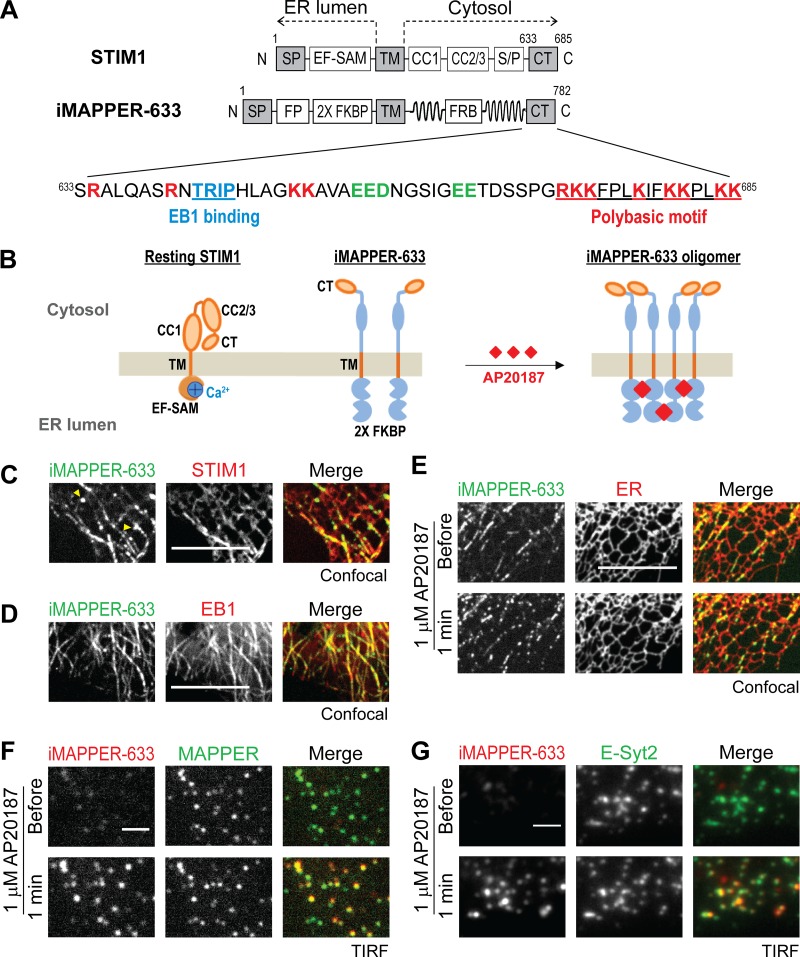
iMAPPER-633: A synthetic construct for dissecting targeting mechanisms of STIM1. (A) Diagrams of STIM1 and iMAPPER-633. Amino acid number and domains are indicated. EF-SAM, EF hand and sterile α motif; FRB, FKBP–rapamycin binding domain. Identical domains between STIM1 and iMAPPER-633 are in gray. The amino acid sequences of STIM1 CT are displayed. Core EB1 binding motifs are labeled in blue, positively charged residue are in red, and negatively charged residues are in green. (B) Schematic diagram depicting resting STIM1 and iMAPPER-633 and oligomerized iMAPPER-633 after AP20187 treatment. Domains are indicated as in A. (C) Localization of YFP–iMAPPER-633 in HeLa cells coexpressing mCherry-STIM1, monitored by confocal microscopy. Yellow arrowheads indicate iMAPPER-633 puncta without STIM1 colocalization, possibly formed because of loss of EB1 binding during MT catastrophe. (D) Localization of YFP–iMAPPER-633 in HeLa cells coexpressing EB1-mCherry, monitored by confocal microscopy. (E) YFP–iMAPPER-633 displays punctate localization after 1 µM AP20187 treatment, monitored by confocal microscopy in HeLa cells cotransfected with mCherry-ER. (F) Translocation of mCherry–iMAPPER-633 to ER–PM junctions after 1 µM AP20187 treatment, monitored by TIRF microscopy in HeLa cells cotransfected with GFP-MAPPER. (G) Translocation of mCherry–iMAPPER-633 to ER–PM junctions after 1 µM AP20187 treatment, monitored by TIRF microscopy in HeLa cells cotransfected with GFP–E-Syt2. Bars: (C–E) 10 µm; (F and G) 2 µm.

