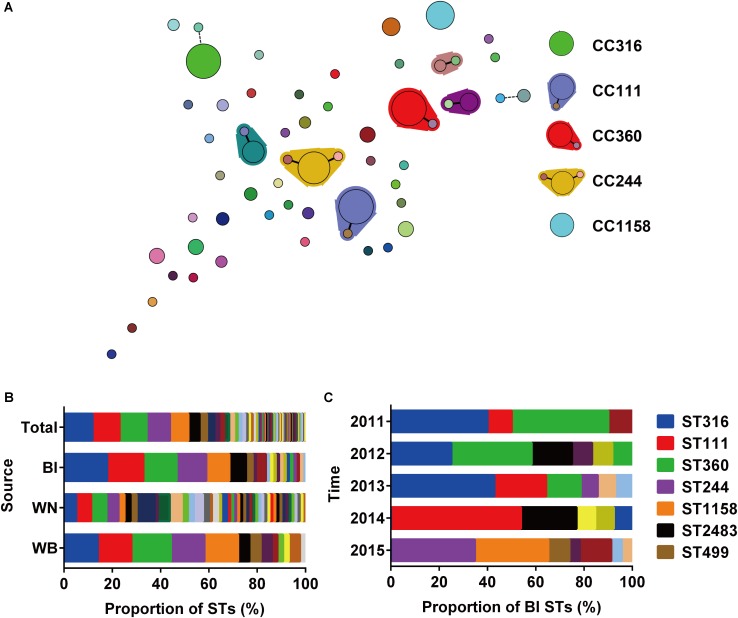
FIGURE 1.
Relationships and population analysis of sequence types (STs). (A) Minimum spanning tree of STs created by BioNumerics. Each solid circle denotes one ST, and the area of the circle is proportional to the number of isolates. A solid or dashed line between circles indicates that the two linked STs share six or five identical alleles. STs enclosed by shaded areas constitute a CC. The main STs and CCs are shown on the right. (B) Composition of STs isolated from different sources. Bl, bloodstream; WN, wound samples from patients without bacteremia; WB, wound samples from patients accompanied by bacteremia. (C) Composition of STs among strains isolated from the bloodstream at different times.

