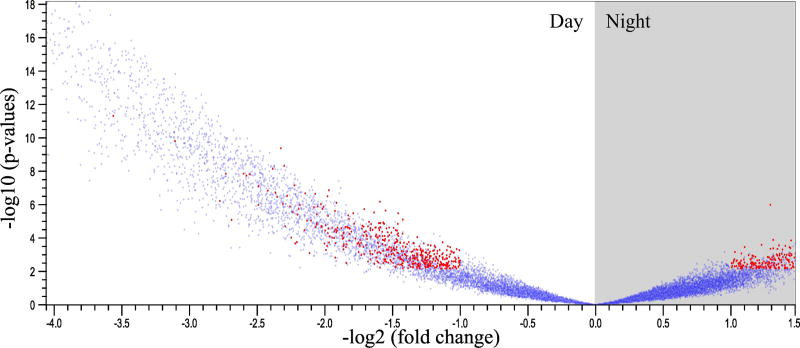
Fig. 2. Volcano plot of differentially expressed genes in N. vectensis under oscillating light conditions.
The volcano plot shows transcriptome-wide oscillations in gene expression (blue dots) of approximately 24,000 genes, where ~13% were differently expressed in the light or dark when cultured under LD conditions (red dots).

