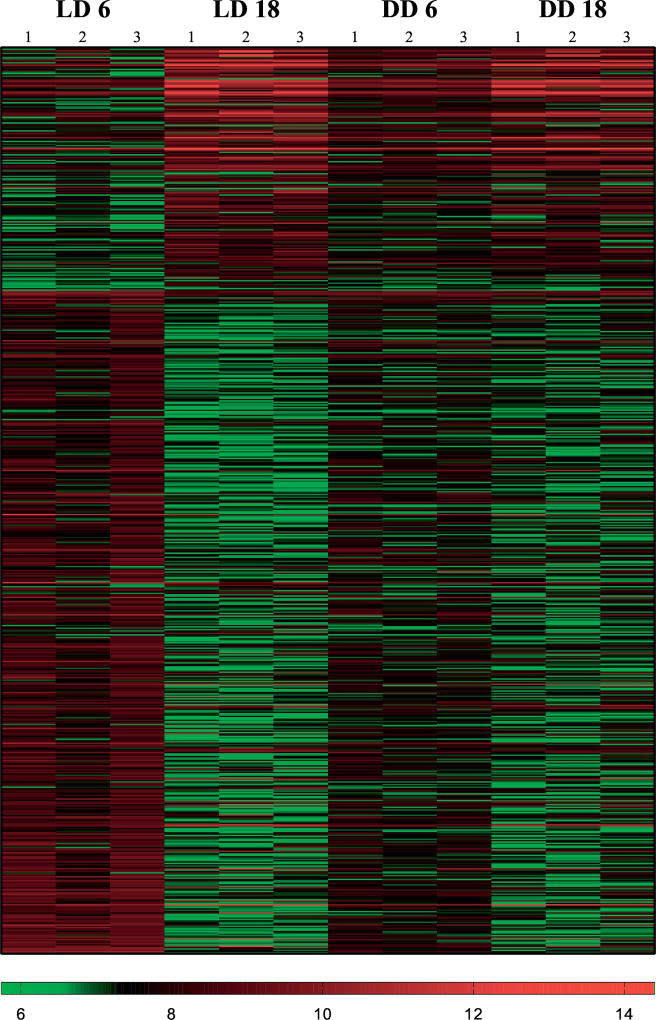
Fig. 3. Heat map of DEG in the absence of light.
Heat map of differentially expressed genes under 12:12 hour light:dark (LD) conditions or constant dark conditions (DD). Red bars show upregulated genes. Green bars show downregulated genes. Each column represents replicates in each light condition (LD, DD) at each time point (ZT6, ZT18).

